In May of 2023, when the World Health Organization downgraded the coronavirus emergency from a global health pandemic to an "ongoing health crisis," the shift made sense in many ways. Most developed nations have made vaccines available for over two years. Shutdowns and enforced quarantines ended, even in holdout nations. The WHO's announcement signaled that other countries, including the United States, would follow suit if they had not already. This move, however, will have material consequences for grassroots charitable organizations across the US. Endstate ATL (ESA), a group I have worked with since 2021, is one of many non-profit groups that will be affected.
In Georgia, the COVID state of emergency officially ended in May 2022, even as it remained in place at the national level. This allowed organizations like ESA to continue our mutual aid work. But when the US announced the end of the Federal COVID-19 Public Health Emergency (PHE) Declaration on May 11, 2023, enhancements to public assistance and social safety net programs ceased. From this point on, groups like ESA once again will have to jump through multiple bureaucratic hoops to obtain the funding necessary to provide care.
Following the global outbreak of COVID in 2020 many governments created temporary measures to extend aid to vulnerable populations. In the US, these included extensions of unemployment benefits, a moratorium on student loan interest and payments, no-cost COVID testing and vaccinations, Medicare flexibility, and opportunities to provide nontaxable disaster relief funds. The national government also released relief funds to individual state governments, although often these funds did not reach the people who needed them.1Rebecca Riess and Devon M. Sayers, "Alabama Governor Signs Bill to Use Covid-19 Relief Funds to Build Prisons," CNN, October 1, 2021, https://www.cnn.com/2021/10/01/politics/alabama-covid-relief-prison-bills-signed-governor-kay-ivey/index.html. Despite the uneven distribution of aid, many people, specifically children and elders, moved above the poverty line thanks to COVID assistance.2John Creamer, "Supplemental Poverty Measure That Accounts for Additional Government Benefits Lowest on Record at 7.8%," Census, September 13, 2022, https://www.census.gov/library/stories/2022/09/government-assistance-lifts-millions-out-of-poverty.html.

The flexibility surrounding nontaxable disaster relief funds eased mutual aid work. Mutual aid has a long history in the US and Global South, and the onset of the COVID-19 pandemic witnessed an outpouring of community solidarity towards those in need. Mutual aid stands apart from other charity models because of its non-hierachal emphasis on mutualism rather than models that maintain divisions between givers and receivers. Mutual aid is rooted in reciprocity.
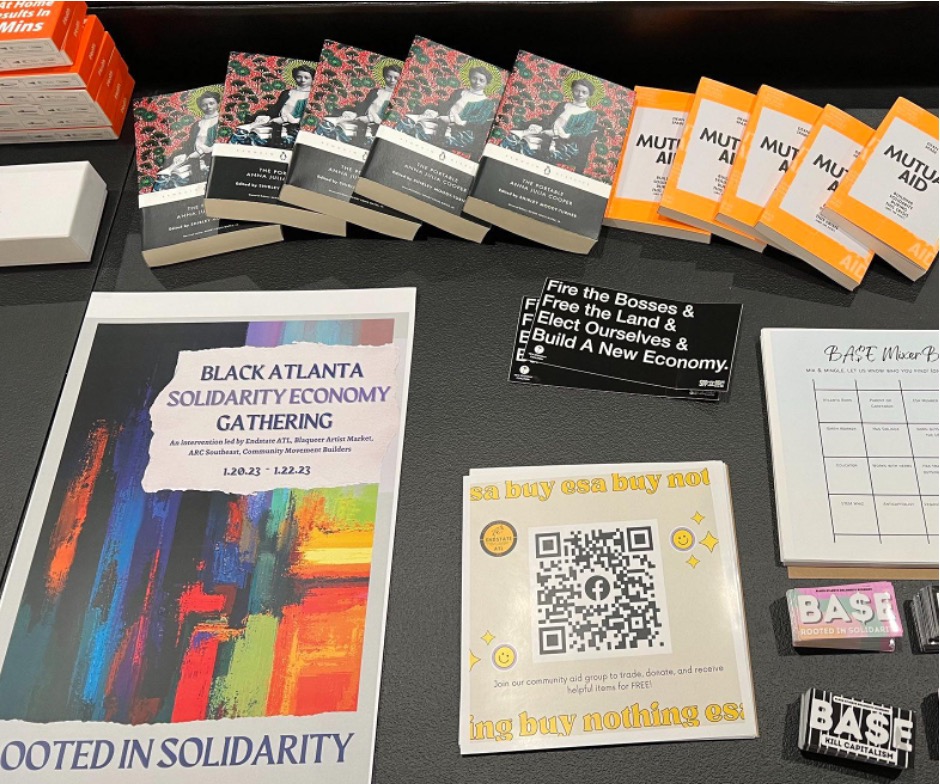
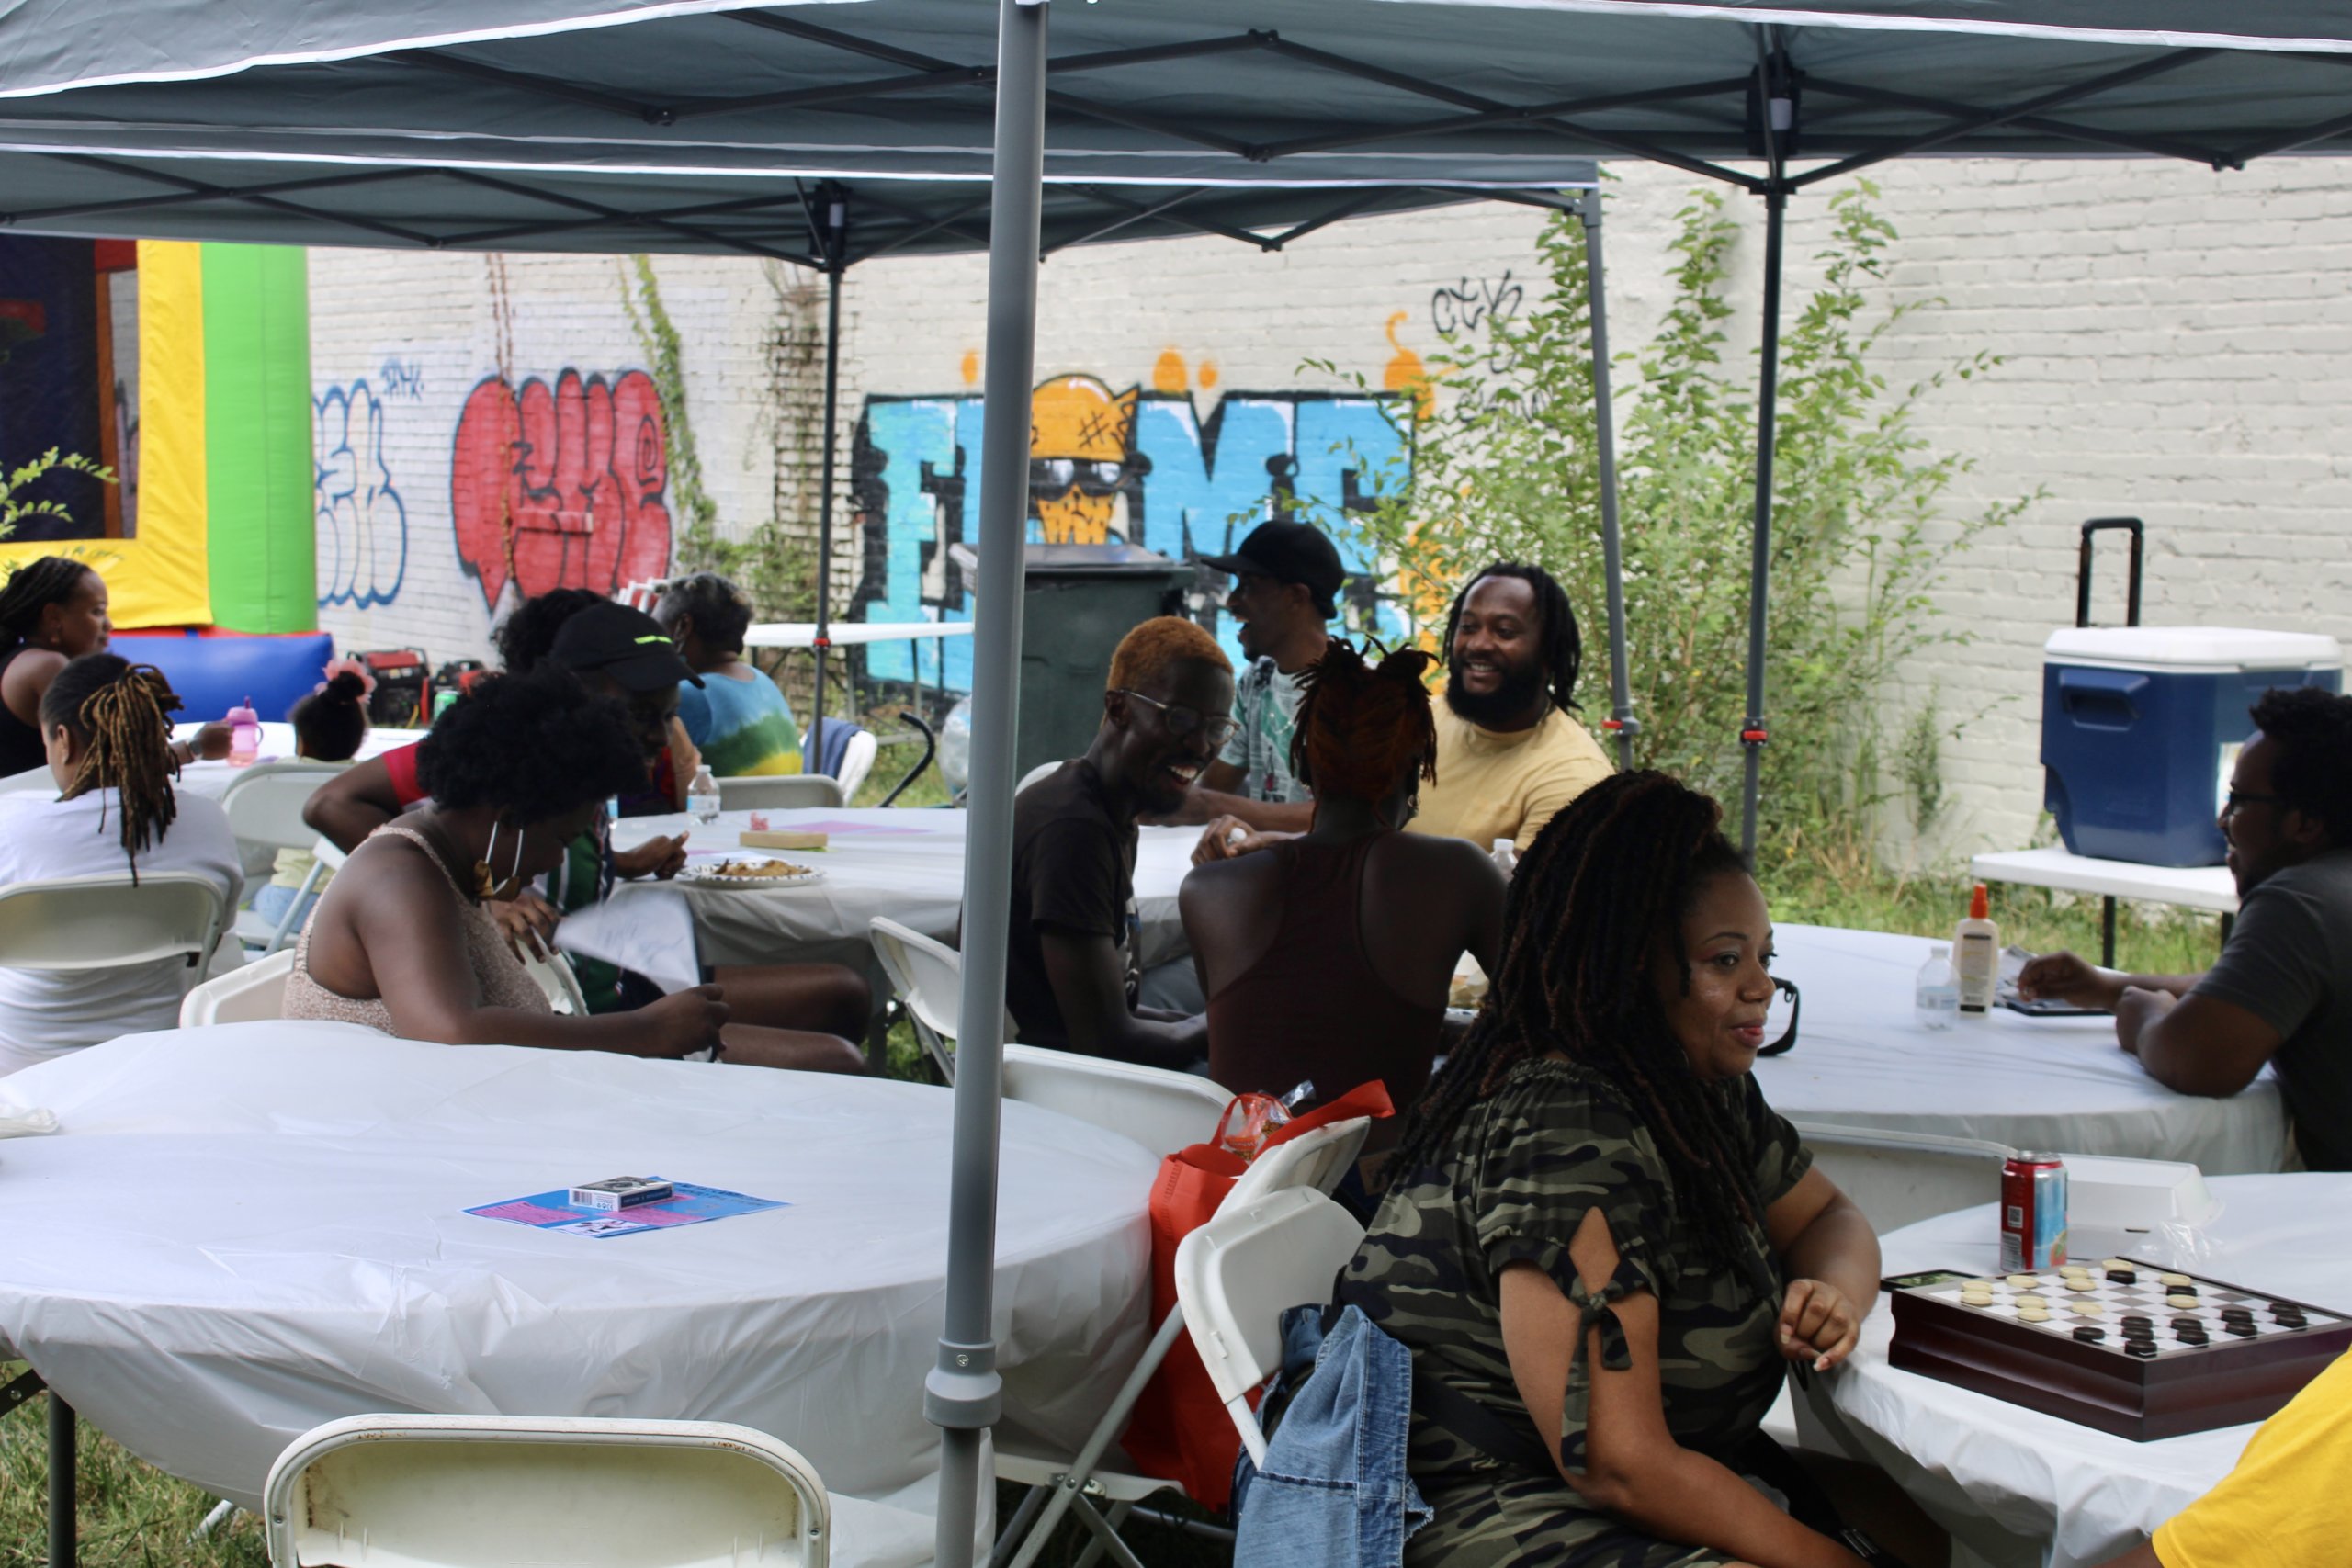
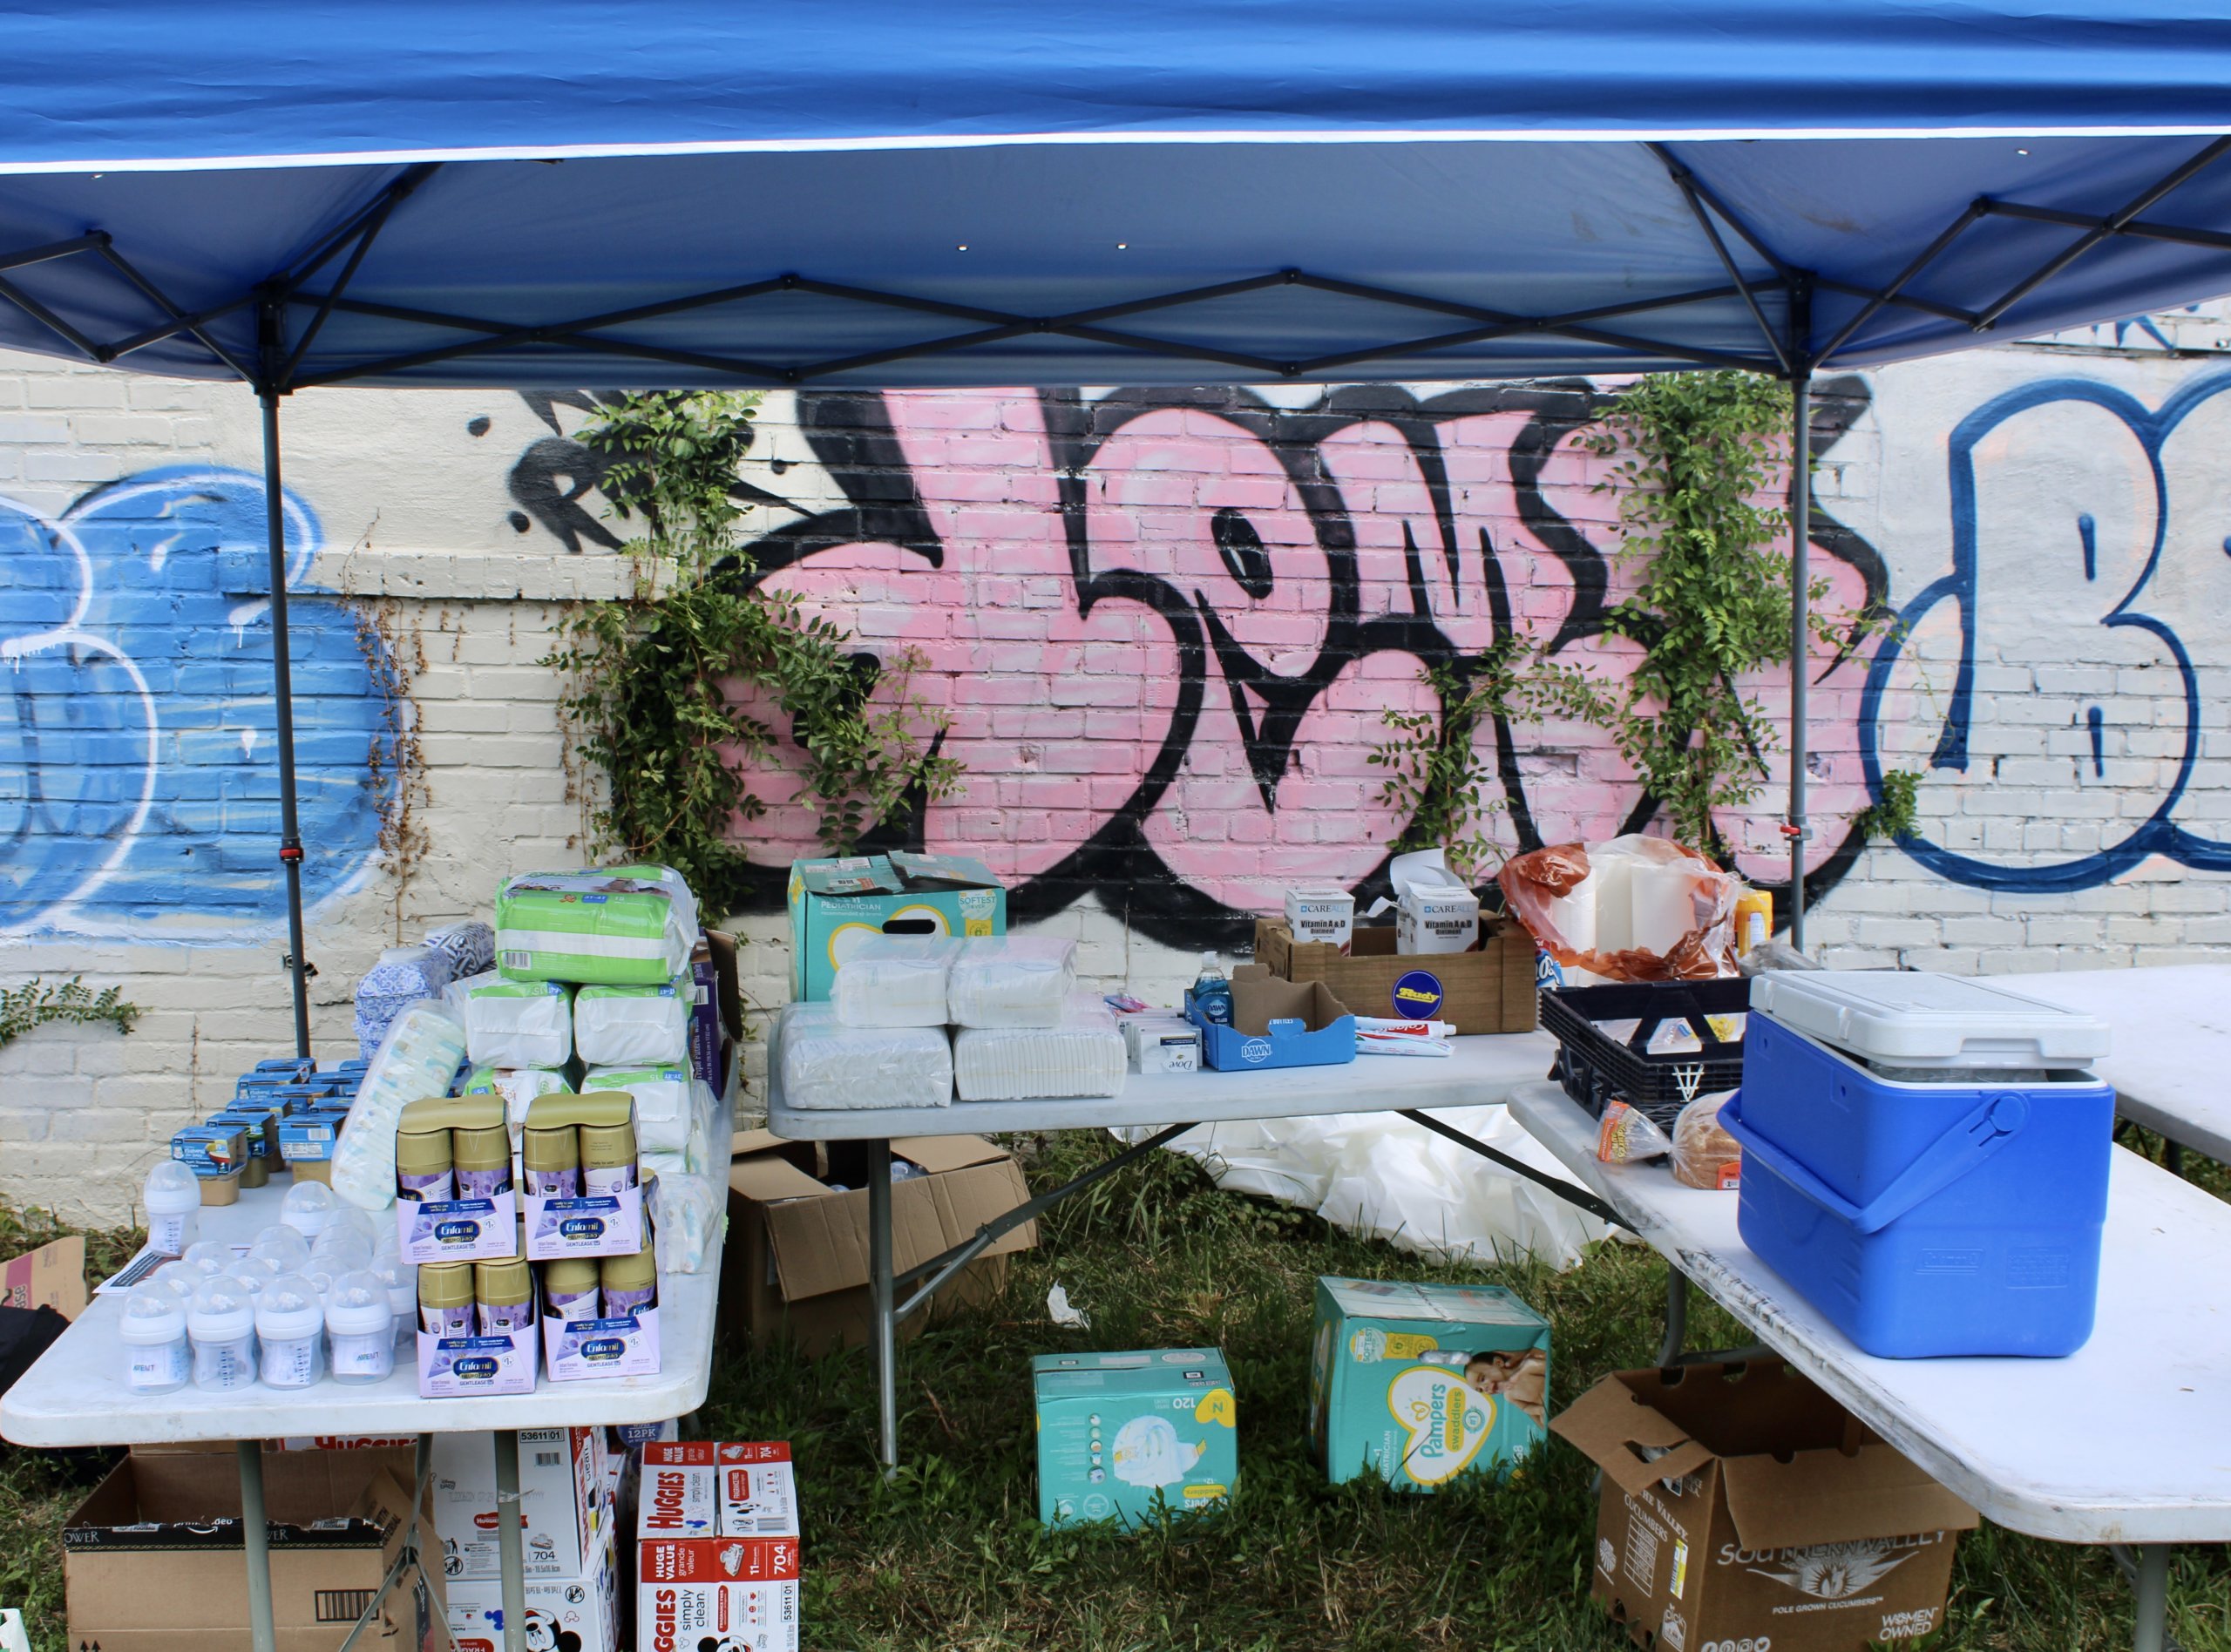
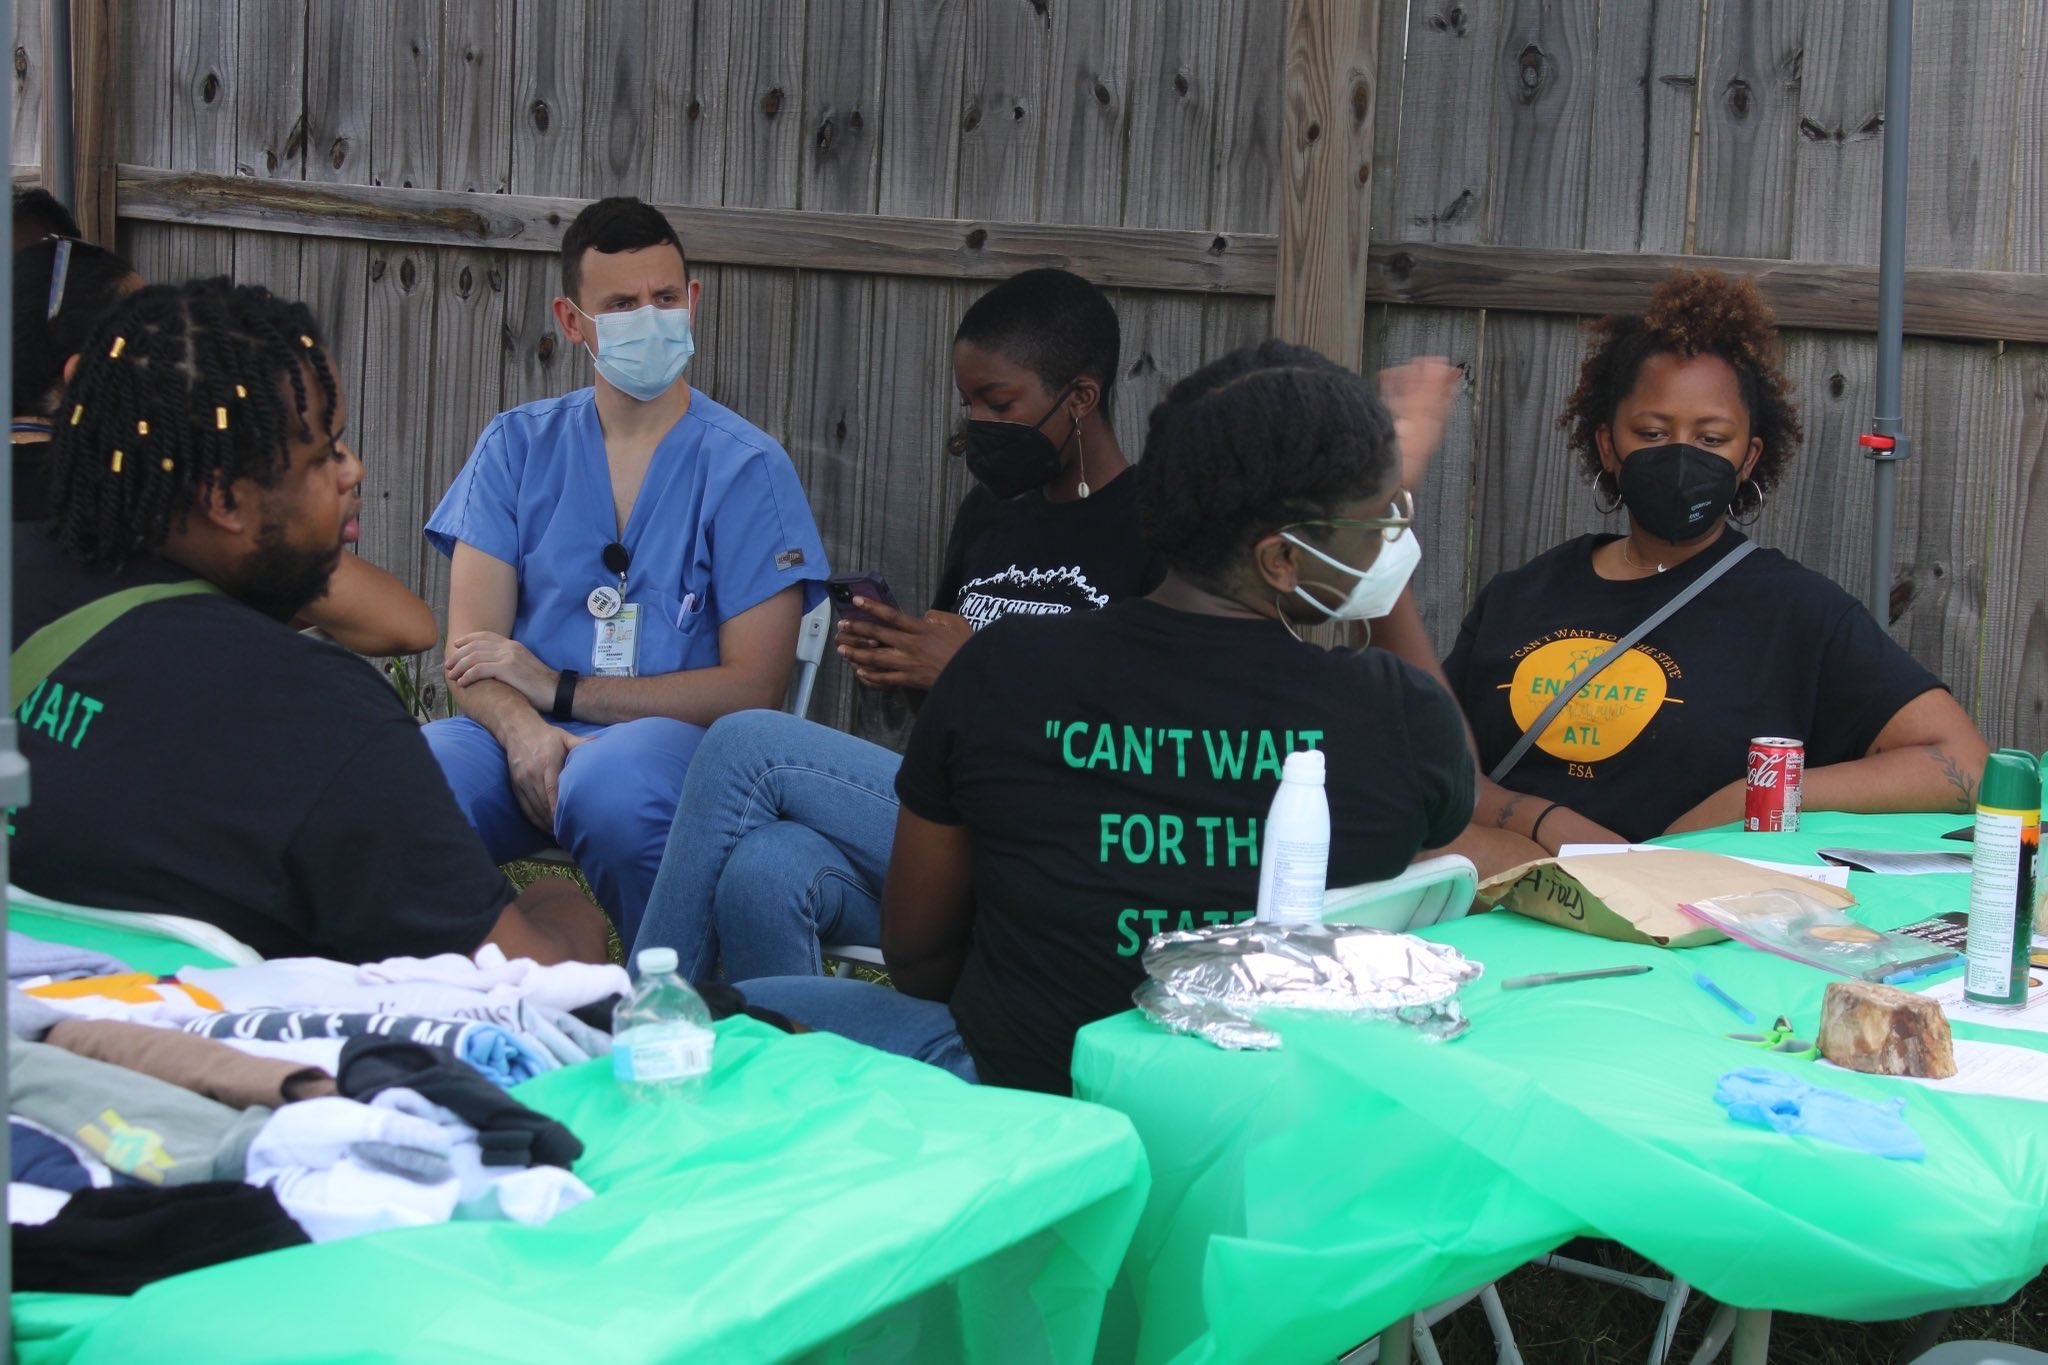
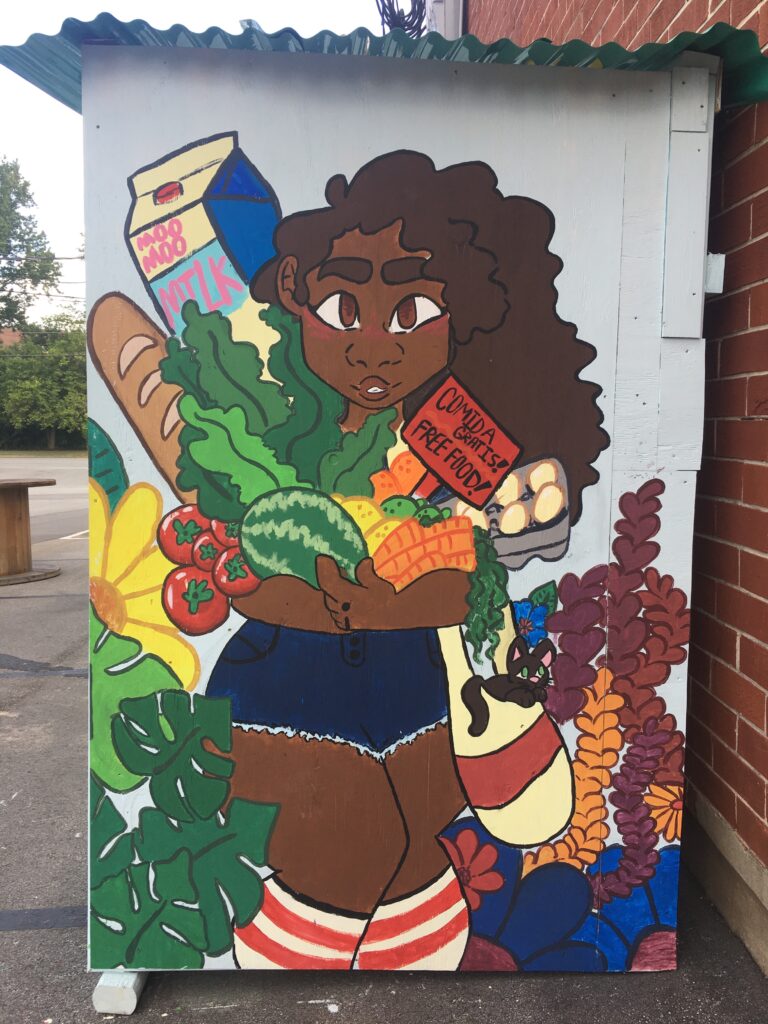
Endstate ATL took advantage of these temporary measures for the betterment and aid of our community members. Rooted in southwest Atlanta with a Black queer feminist politic, ESA's work aims to reach those most marginalized through community building, political education, and mutual aid. Through our Black Power Fund, which pays up to three months' worth of utility bills for Black queer households, and our Pack Provides Programs, which provide household supplies, COVID PPE, and infant essentials including formula, clothing, and sanitary products to caregivers of young children, we seek to step in where the state fails to provide support.
Mutual aid allows organizations to provide immediate care and relief to individuals in need without imposing the bureaucratic processes that often keep aid beyond reach. Under a state of emergency, disaster relief payments are not taxable. As such, ESA, and other groups like it, were able to provide direct aid through a less convoluted system of reporting and disbursement. This allowed us to move funds directly and rapidly to people in need and has been crucial to our ability to substantively support people in a timely way. ESA has covered bills for ten households in the past year, as well as covered a year of utilities for the BARRED Business house, which provides stable, community-owned housing for people recently released from prison. We have been able to report these funds as disaster relief.3"Mutual Aid Legal ToolKit," Sustainable Economies Law Center, Accessed June 22, 2023, https://www.theselc.org/mutual_aid_toolkit.


The efforts of mutual aid groups helped supplement aid where state and local leadership failed. Georgia governor Brian Kemp refused to take the COVID-19 pandemic seriously. In 2020, Georgia was the first state in the nation to relax quarantine restrictions, even as Kiesha Lance Bottoms, the mayor of Atlanta, sought to retain many protective measures. Initial reporting that the virus would largely impact the elderly and immunocompromised, combined with anti-fear government propaganda, engendered a sense of invincibility and an attitude of disregard among many Georgians. As of 2021, Georgia had one of the highest COVID mortality rates in the US, and those most impacted were poor, working class, and people of color.4"COVID-19 Mortality by State," CDC, Accessed June 22, 2023, https://www.cdc.gov/nchs/pressroom/sosmap/covid19_mortality_final/COVID19.htm. The refusal of Governor Kemp to implement mandated social distancing or mask requirements, even before vaccines were available, left the entire state population vulnerable to infection. The consequences were devastating, with thousands of unnecessary deaths and debilitating outcomes for those suffering from long COVID.
Pandemic relief payments meant to alleviate the burden of rising interest rates were out of reach for marginalized Georgians. In order to receive national stimulus checks and Kemp's own "special tax credit," individuals needed to have filed and paid taxes for the preceding two years, a barrier that left people who were unemployed or homeless without access to relief.5"Gov. Kemp Announces First Round of This Year's Special Tax Refund," Department of Revenue, May 1, 2023, https://dor.georgia.gov/press-releases/2023-05-01/gov-kemp-announces-first-round-years-special-tax-refund#:~:text=Single%20filers%20and%20married%20individuals,a%20maximum%20refund%20of%20%24500.
In response to the pandemic, groups emerged such as Bed Stuy Strong, based in Brooklyn, which created a robust grocery delivery system by first relying on the resources at their disposal before evolving into a program that benefited thousands.6Haritha Kumar, "Four Key Takeaways from Mutual Aid Organizing During the COVID-19 Pandemic," Georgetown University Beeckcenter, October 4, 2022, https://beeckcenter.georgetown.edu/four-key-takeaways-from-mutual-aid-organizing-during-the-covid-19-pandemic/. Georgia has similar organizations. Community Movement Builders developed stabilization programs that include rent/mortgage payments as well as groceries in their efforts to impede the gentrification of southwest Atlanta, and Food4Lives a non-profit started by Georgia Tech and Emory students provides food and supplies for the unhoused in the greater Atlanta area.7Katie Burkholder, "Housing as a Human Right: Community Movement Builders Organize Against Gentrification," Georgia Voice, April 21, 2022, https://thegavoice.com/today-in-gay-atlanta/housing-as-a-human-right-community-movement-builders-organize-against-gentrification/; "Who are We?" Food4Lives, Accessed June 22, 2023, https://food4lives.org/about.html. Both organizations preceded the pandemic, but their work became much more indispensable in its wake.
The increase in groups doing this aid work was significant, especially in red states where Republican leadership champions laissez-faire government structures for almost everything but reproductive health, policing, and surveillance. Pandemic or no pandemic, people need help. However, smaller aid groups face difficulties in keeping the work going. ESA has primarily been funded by grants, a funding model that is not easily sustainable. According to one of our members, "A significant struggle we've faced since the end of the COVID-19 pandemic is the philanthropic and public perception that the conditions for folks have changed enough that mutual aid is not necessary even as we continue to field a significant number of requests." Further, all members participate on a volunteer basis, spending much of our time otherwise as graduate students, teachers, doulas, herbalists, and nonprofit workers. Over the last two years, many of us have faced our own destabilizing events, financial uncertainty, bouts of COVID, and family loss. The ability of small groups to come together and push to make a difference in their communities—despite personal difficulties and decreasing assistance from governing bodies—should inspire more activism. But the question remains, how can we continue this work when governmental policies have resumed restricting social safety nets while offering few, if any, alternatives?
Changing policy is one problem organizers face, burnout is another. Studies have suggested that we approach "burnout as a part of activism and as influenced by the organizational context, rather than as something that individual activists experience outside of activism."8Maria Fernandes-Jesus et al., "More Than a COVID-19 Response: Sustaining Mutual Aid Groups During and Beyond the Pandemic," Frontiers in Psychology 12 716202, October 2021, https://www.ncbi.nlm.nih.gov/pmc/articles/PMC8563598/. However, as young Black people organizing in the South, my colleagues and I experience burnout from many directions. We deal with the stress of everyday life, as well as the difficulty of doing our solidarity work, with constant reminders from government leadership that our goals are at odds with theirs.
With the COVID state of emergency ending in the US, aid provided by organizations such as Endstate ATL becomes taxable, dramatically altering the way funds can be mobilized, as well as the process that recipients must go through to receive support. Charitable tax deductions are reserved for individuals and corporations who donate money to qualified charities.9Up until December 2021, entities meeting these requirements were able to claim as much as 100% of their AGI in charitable tax write offs. "CARES Act Charitable Benefits Not Extended For 2022," Stanford Giving, March 14, 2022, https://giving.stanford.edu/stories/cares-act-not-extended-for-2022/. Because ESA puts money "directly" in the hands of marginalized people, such direct contributions to individuals are not tax-exempt. The COVID state of emergency allowed groups like ESA to move funds to individuals more freely—on an emergency basis. The end of the state of emergency means we must restructure our aid programs. The beautiful thing about mutual aid is that even if one group burns out, another group can and likely will step up right behind to fill the gap. In this way, the work continues. We never stop. 
About the Author
Ra'Niqua Lee writes to share her particular visions of love and the South. She earned an MFA in fiction from Georgia State University, and she is currently at Emory pursuing a PhD in late nineteenth/early twentieth century African American literature with a focus on spatial and Black queer feminist theories. Her fiction has appeared or is forthcoming in Cream City Review, SmokeLong Quarterly, Indiana Review, Passages North, Best of the Net 2023, Best Small Fictions 2023, and elsewhere. In 2021, the Georgia Writers Association awarded her the John Lewis Writing Grant for fiction. Her flash collection For What Ails You is forthcoming from ELJ Editions.
Acknowledgments
Many thanks to my colleagues. Without their collaborative support, I would not be able to do this work: Julian Rose, Britni Ruff, Christina Foster, Michelle, Jovan Julien, and extra thanks to Hugh Hunter for his early edits.
Public Health in the US and Global South is a collection of interdisciplinary, multimedia publications examining the relationship between public health and specific geographies—both real and imagined—in and across the US and Global South. These essays raise questions about the origin, replication, and entrenchment of health disparities; the ways that race and gender shape and are shaped by health policy; and the inseparable connection between health justice and health advocacy.
Beginning in 2022, the series expands to include 1000-word blog posts, as well as longer commentaries, essays, articles and media productions that address the public health and political implications of the COVID-19 pandemic from multiple perspectives. The series editor for Public Health in the US and Global South is Mary E. Frederickson.
Video and Essay
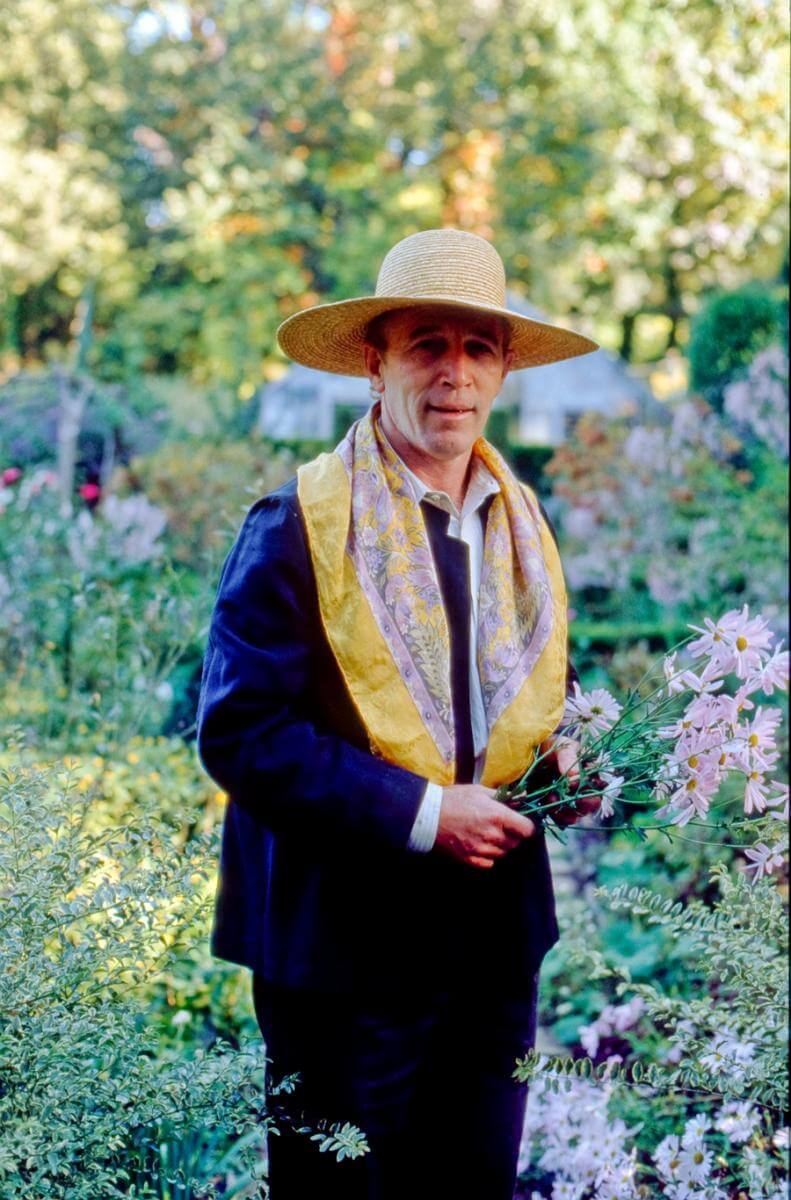
Ryan Gainey (1944–2016) grew up in the Sandhills of South Carolina in the small town of Middendorf, twelve miles north of Hartsville. Born to a working-class family, Gainey picked cotton at an early age with his brothers, sister, and cousins. Through relatives and neighbors, he developed an early love for propagating plants, rooting camellias in Mason jars underneath the eave of a barn (where they could catch the rain), and learning to grow old-fashioned varieties of petunias and roses. In the 1960s, Gainey studied horticulture at Clemson University, served in the Navy, and eventually settled in Atlanta. He opened a series of garden shops in the affluent Buckhead neighborhood that were successful in part because there were few other boutique garden shops in the area at the time. Gainey sourced many of his plants from the Holcombe Nursery in Decatur, five miles east of Atlanta. When he learned that the Holcombe family wanted to sell their property in 1980, he jumped at the chance.
Gainey envisioned a beautiful new garden in the informal cottage style, using the aged brick walls of the old Holcombe greenhouses as the boundaries for a series of "garden rooms." As his creations garnered attention, he received commissions around the city. Although not formally trained in landscape design, Gainey, through self-study and experimentation, developed a distinctive style that combined cottage garden aesthetics and classical English design with a strong reliance on native plants. By the 1990s he'd become internationally renowned, forming friendships with such English gardening notables as Rosemary Verey and Penelope Hobhouse.

Chad Stogner, founder of the garden accessory company Elegant Earth, worked with Gainey in the 1990s and noted that the designer had a way of "making things look spontaneous. . .that were planned." Most gardeners work to eliminate weeds, but Gainey would allow them to pop up in certain areas. To visitors, these would appear as happy accidents, but they were deliberate, as Gainey explained in his 1993 book The Well-Placed Weed from which our documentary takes its title. Gainey's gardens feature a fascinating give-and-take between the structured and the free-flowing.

Gainey chose many of the plants in his garden for their personal and historical connections, such as the chinaberry tree (Melia azedarach), which was a prominent feature in his childhood yard and also was, as he liked to point out, one of Thomas Jefferson's favorite plants. He discouraged gardeners from mimicking the plant choices of classical English gardens and instead championed the use of native southeastern US plants along with plants from similar latitudes in China and Japan.
In March 2016, a 140-year-old white oak tree that had served as the shady anchor of Gainey's Decatur garden fell on his house. At home at the time and miraculously uninjured, Gainey was forced to relocate to Lexington, Georgia, seventeen miles east of Athens where, in July, he died in a fire trying to save his beloved Jack Russell terriers.
We did our first video shoot with Gainey in the spring of 2010. At the outset, we didn't know what we were doing and were content to let him unspool lectures on gardening topics of his choosing: the history of tea olives or figs, blending purple and gold plant colors, and how to maintain fragrance year-round. He thought we were producing a gardening masterclass. None of us thought we were making a documentary.

We became fascinated with the funny moments just before or just after he delivered his monologues—such as when he'd yell at his dogs or tell a dirty joke or make some ridiculous boast. We were drawn to the tangents that floated above and below the persona: his humor, narcissism, and personal connections to plants.
We eventually found structure for the project by developing a series of overlapping threads: Gainey's childhood, his rise as an entrepreneur and social figure in Atlanta, and his wider reputation as garden designer. We were also drawn to his idiosyncratic personality. We witnessed him being prickly and self-absorbed, as well as generous and thoughtful.
There remain gaps in our story. Gainey acknowledged a couple of times on camera that he was gay but never discussed any of his longtime partners in any detail. We tried to steer him to fill in the biographical narrative, but became resigned that there was no directing Ryan Gainey. He served up a vast body of knowledge via his commanding and often contradictory persona. In the end, we did our best to wrangle an honest character study.


We thought we were winding down the project in early 2016 before the tree fell on his house. That event set in motion a string of calamities that culminated in his tragic death. We worked for another year and a half to tidy up the edit and flow before premiering The Well-Placed Weed: The Bountiful Life of Ryan Gainey at a festival in South Carolina in April 2018.
Ryan Gainey made and collected beautiful things. We are grateful that he shared some of these with us and that, through our documentary, we now share this with others.
Visit The Well-Placed Weed's website for more information and to view the documentary in its full length of seventy-eight minutes.
About the Directors
Steve Bransford is the senior video producer at the Emory Center for Digital Scholarship and the founder of Terminus Films. Cooper Sanchez is an artist and garden designer focused on the restoration of historic southern gardens. For ten years, Cooper has been working to rejuvenate the gardens at Historic Oakland Cemetery as well to build his own garden in Clarkston, Georgia.
]]>
I grew up in metro Atlanta watching revitalization efforts spread across the city's many neighborhoods. The rebranding of City Hall East, Krog Street, and the Atlanta Railroad as Ponce City Market, Krog Street Market, and the celebrated Atlanta Beltline underscores a shared aesthetic at the heart of development projects that map new bastions of commerce onto existing urban footprints. Many mixed-use projects include residential neighborhoods replete with spaces targeting Atlanta's young creatives: performance venues for live music and art shows, community spaces for job talks and self-improvement classes, and ubiquitous coffee shops and bars. These developments are creating new buzz about Atlanta's future.
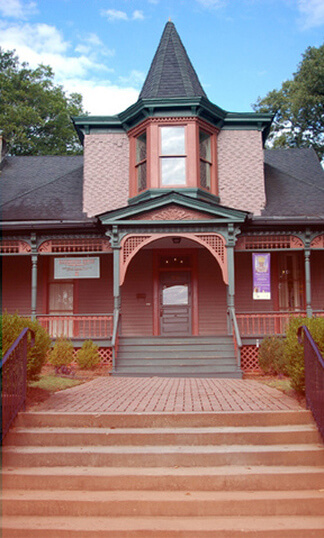
But urban hot spots do not emerge in a vacuum. Instead, they often pop up in black neighborhoods, crowding out institutions vital to artistic and cultural flourishing. Take for example, the next planned stop on the Atlanta Beltline: the Westside. In addition to the Atlanta University Center (AUC), the Westside is home to several black cultural centers, including The Hammonds House Museum, The Wren’s Nest, The Shrine of the Black Madonna, and the Herndon Home Museum. While these institutions do not have the financial resources to refashion their neighborhoods as Atlanta's next "go-to" destinations, they do possess something invaluable to the city’s future—black history.
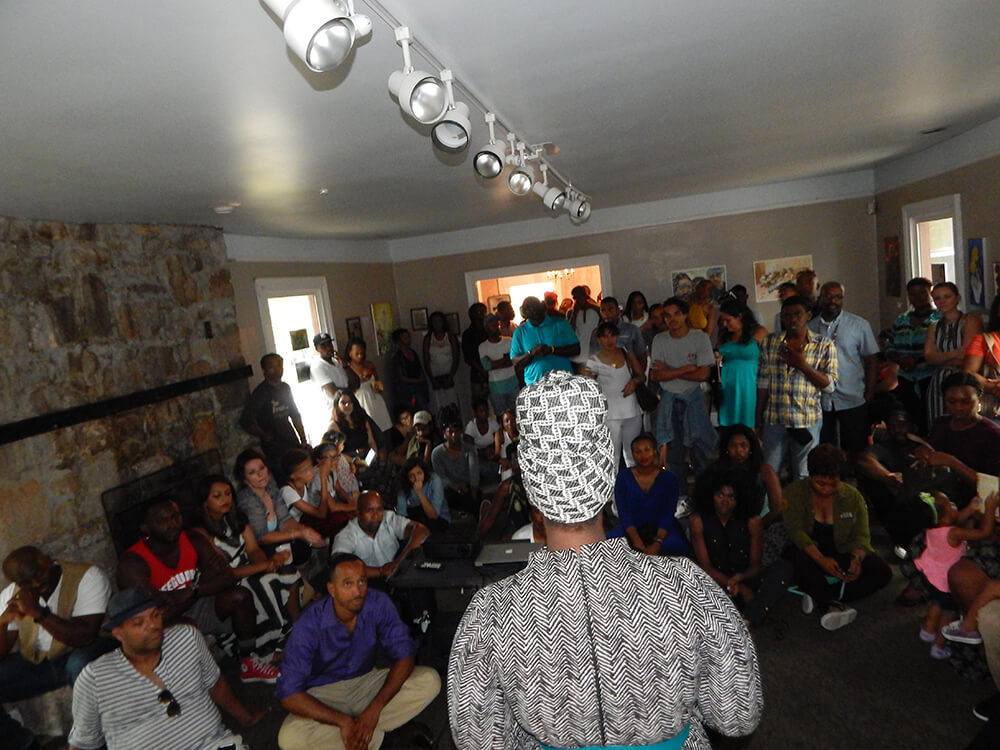
LiFT Art Salon intentionally operates out of historically black buildings, spaces, and cultural centers to redirect Atlanta's young adult population to institutions with long histories of community-building through arts activism and education. In this spirit, we hosted one of our first LiFT gatherings in the Hammonds House Museum. Founded in 1988, the Hammonds House Museum serves as one of Atlanta's premiere institutions of African American and African diasporic art. The July 12, 2015, event was titled #homeplace, an homage to bell hooks's essay about black women's homes as sites of resistance and to Hammonds House original owner and resident Otis Thrash Hammonds, a prominent Atlanta physician and avid black art collector.
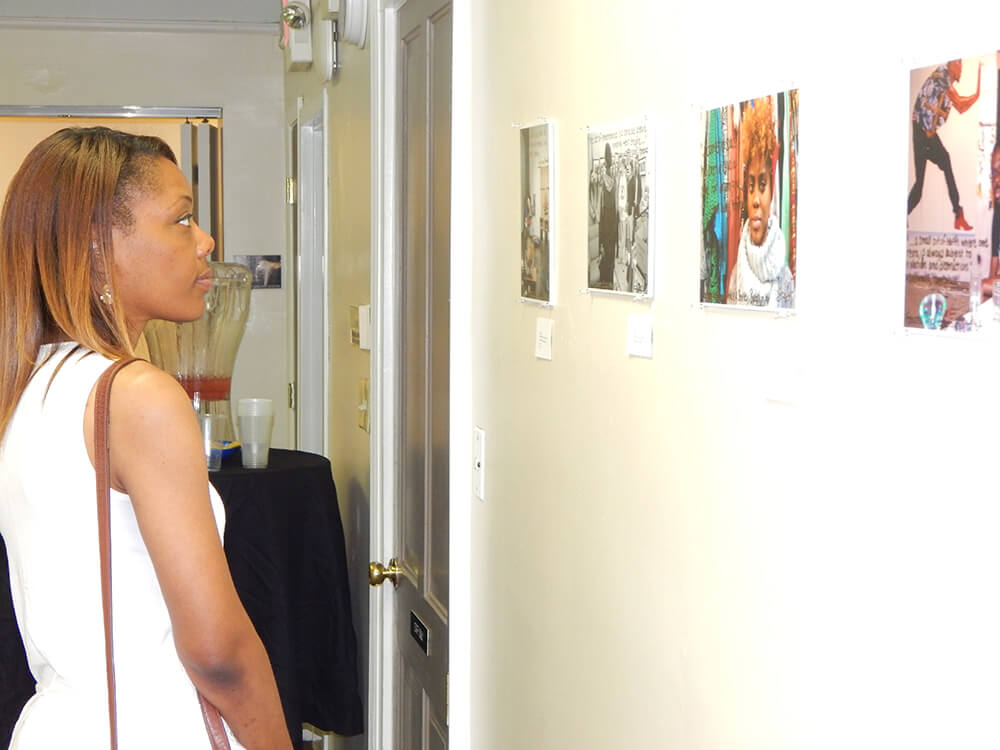
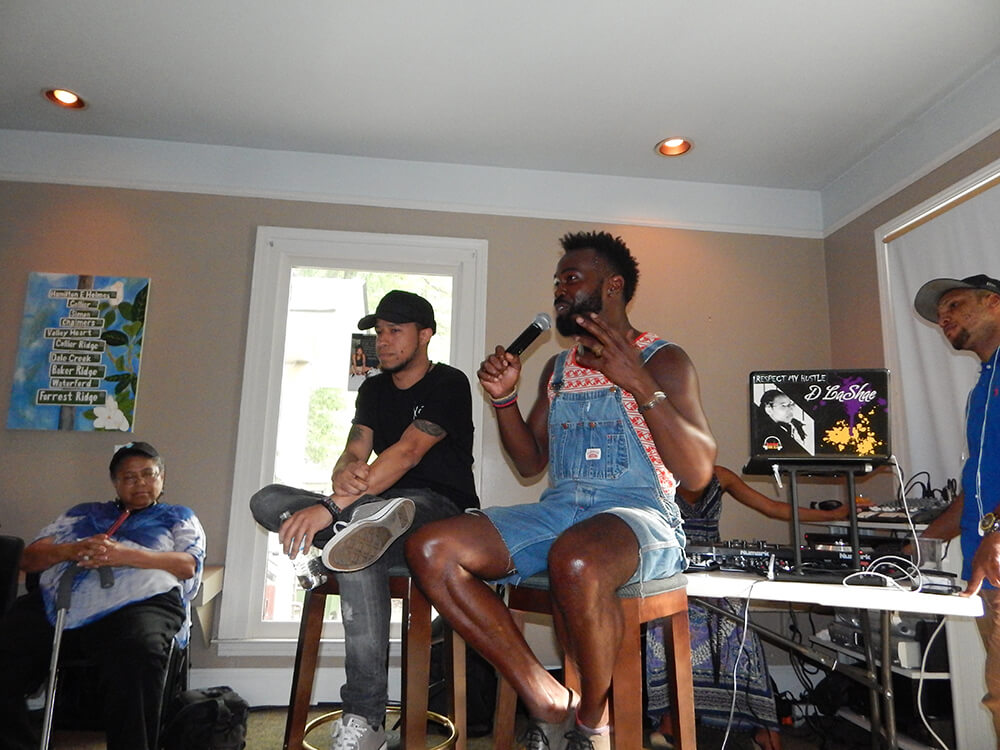
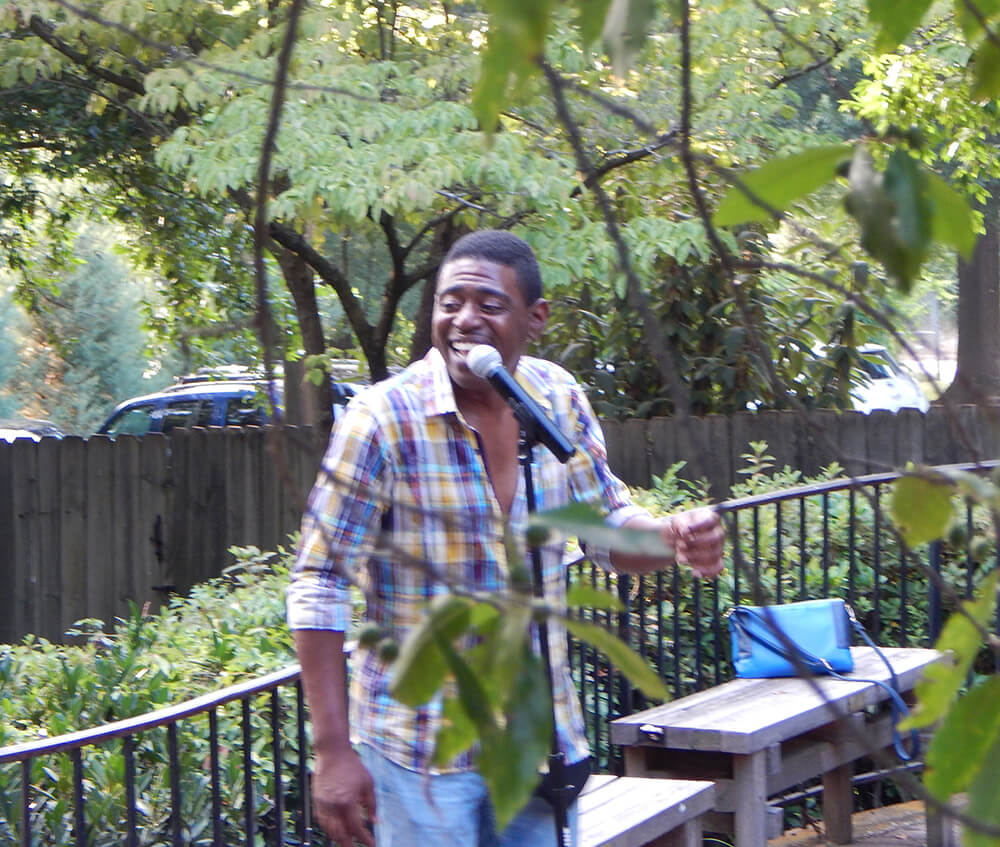
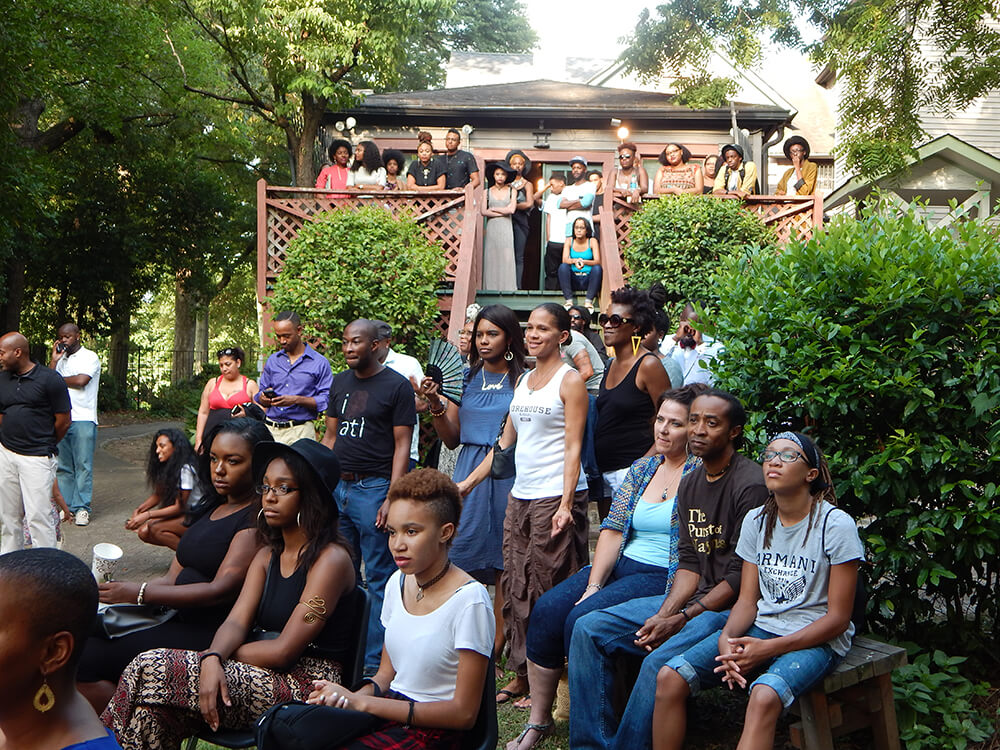
To celebrate #homeplace and showcase the historic building, our event included four components staged across the footprint of the Hammonds House. The first act featured an exhibit of visual art from the LiFT Art Collective. Curated by Shady, each visual artist produced work that interpreted homeplace. Stephanie Alvarado offered a spoken word performance about the challenges of finding "home" as a South American émigré to New York City. WERC Crew's Xavier Blk and Will Edmond, two of Atlanta's hottest DJs and party promoters, discussed their business philosophy and the "creative" benefits of living as a collective. Finally, hometown R&B singer, Donnie, gave a concert in the Hammonds House courtyard.
Over the course of the event, the performances came together in unexpected ways. In a recent interview, event coordinator Miriam Denard explained how the performers and attendees drew inspiration from the museum and its standing exhibits:
This event really opened our eyes to the variations of expression and experience we can have at each Art Salon without losing the essence of the event. People were up and moving around and able to sit by different guests, sharing the experience. And then to end the evening with live, outdoor music was really special because it pulled the theme—of the home as place of community, affirmation, and resistance—together with the standing exhibits on display at the Hammonds House Museum.1Miriam Denard, phone interview with author, January 15th, 2016, Atlanta, Georgia. Transcription by author
Lydia Harris's photography exhibit "The View From Collier Heights" was hanging during the #homeplace event. Harris's exhibition featured a collection of photos from Collier Heights, a neighborhood developed in the 1950s to house Atlanta's sizable and growing black middle class. Harris's photos captured both the facades and interiors of the homes and provided a visual backdrop to the LiFT performances.
We packed a lot of punch into this first of several events that LiFT hosted at the Hammonds House in 2014 and 2015. As Atlanta makes important strides towards revitalizing urban neighborhoods, LiFT understands its work as making visible, promoting, and drawing on the rich histories of institutions and cultural centers already in place and at work across the city. LiFT Art Salon challenges readers and event attendees to look long and hard at neighborhoods undergoing revitalization and gentrification; often, beneath the shiny facades and new aesthetics, vibrant, intentional black communities are already in place.
]]>Introduction

In August 2015, the Collier Heights home of Herman J. Russell (1930–2014), African American construction and real estate executive, came on the Atlanta market for $675,000. The listing video characterizes Russell's home as a hub for both real estate transactions, political strategy sessions, and community barbecues.1After two price reductions, as of January 2016, the house was listed at $497,000. See Phil W. Hudson, "Herman J. Russell's home hits the market," Atlanta Business Chronicle, January 8, 2016, http://www.bizjournals.com/atlanta/news/2016/01/08/herman-j-russell-s-old-home-hits-the-market.html; Kimberly Turner,"House Envy: Andrew Young reminisces on Herman J. Russell's 1963 Home," Atlanta Magazine, January 20, 2016, http://www.atlantamagazine.com/homeandgarden/house-envy-andrew-young-reminisces-on-herman-j-russell-1963-home/. The founder of H.J. Russell & Co. was a key player in the city's racially-shifting midcentury real estate business and power structure. Collier Heights, originally a predominately white neighborhood in Atlanta’s southwest corner, would not have welcomed Russell when he founded his company at the height of Jim Crow restrictions in 1952. The 8,761-square-foot residence on 714 Shorter Terrace signals the hard work and commitment of businessmen and women, like Russell, who established residential and retail districts for Atlanta’s growing black middle class. In 2009, the National Register of Historic Places recognized Collier Heights as the first neighborhood developed, financed, designed, and constructed by African Americans for African American residents.2See Betsy Riley, "Collier Heights awarded Local Historic district status," Atlanta Magazine, May 16, 2013, http://www.atlantamagazine.com/civilrights/collier-heights-awarded-local-historic-district-status/; U.S. Department of the Interior, National Park Service, National Register of Historic Places Registration Form: Collier Heights Historic District Application, NPS Form 10-900,OMB No. 1024-0018, received by NPS May 15, 2009, http://www.nps.gov/nr/publications/sample_nominations/CollierHeightsHD.pdf.

As of 2016, Collier Heights is a neighborhood of approximately 1,700 single-family homes in 54 separate but interrelated subdivisions on over one thousand acres. Fleeing urban displacement, impoverished schools, and rampant segregation, African American residents moved to Collier Heights en masse between 1952 and the late 1960’s, redefining the area’s color line and populating a neighborhood important in the civil rights movement. Former residents include Martin Luther King Sr., Christine King Farris, and Ralph David and Juanita Abernathy.
Lydia Harris: Photographer's Statement

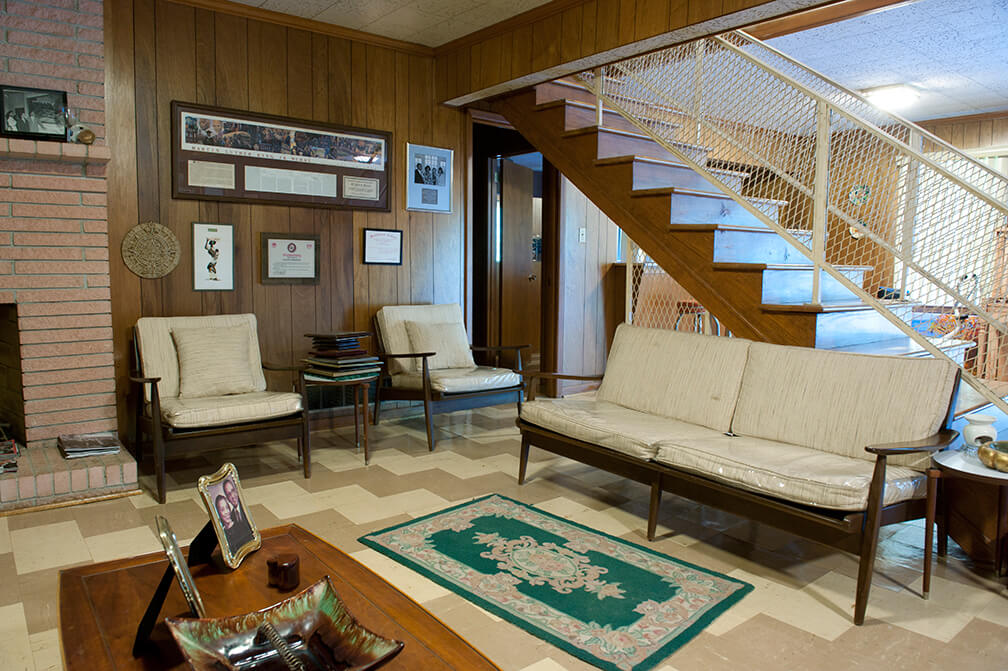
In 2010, I began taking portraits of homeowners in front of their Collier Heights houses using my 4x5 large format camera. After spending two years meeting with residents and making images of facades, I began conducting oral history interviews and taking photos inside neighborhood homes. These sessions became the 2015 book and photo exhibition, "The View of Collier Heights," staged in the Auburn Avenue Research Library Auxillary Gallery at Atlanta’s Hammonds House Museum.
For this Southern Spaces photo essay, I include "Facades," photos of the homeowners ("Faces"), along with several interiors ("Recreation Rooms" and "A Seat at the Counter") of Collier Heights homes. During Jim Crow, when owning a home was a civil rights victory unto itself, neighborhood residents made full use of their hard-won residences. These photographs suggest how facades and recreation rooms (with furniture, home design, objects, and décor) expressed one style of African American domestic life in midcentury Atlanta.
Facades

The home of Mr. Alfred and Dorothy Knox in the Royal Oaks Manor subdivision of Collier Heights, October 14, 2012. "This was a kind of remote area of the city when we first moved here," Knox, a businessman explains. "We were displaced by urban renewal. And although I kind of objected to being displaced, because I had a business there, and I had great plans for improvement in the community, south of the city here, but we lost all and moved here. And we are very glad that we moved here. Very pleasantly surprised to have such good neighbors." Knox, interview by author, May 13, 2013.

The home of Mr. Roger Mathews located in the Valhacha subdivision of Collier Heights, November 9, 2011.

The home of Mr. Charles and Dr. Lois Moreland in the Royal Oaks Manor subdivision of Collier Heights, October 12, 2013. The Morelands moved into their home in December of 1961.

The home of Dr. William B. Shropshire III and Dr. Marian Shropshire on Waterford Road in the Woodlawn Heights area of Collier Heights, November 14, 2011.

The home of native Atlantan Dr. Harvey B. Smith, who lives next door to the Shropshires, January 9, 2013. Smith was one of the original land buyers in the Woodlawn Heights Development Company, which built and developed significant portions of Collier Heights. He came to this neighborhood because there was a "great need for housing for people within my group, and there were few places you could find to go." Smith, interview by author, January 11, 2013.


The home of Alma and Albert Hayward in the Woodlawn Heights subdivision of Collier Heights. Top, under construction in 1962, and bottom, May 17, 2015. Historic image courtesy of the Haywards.
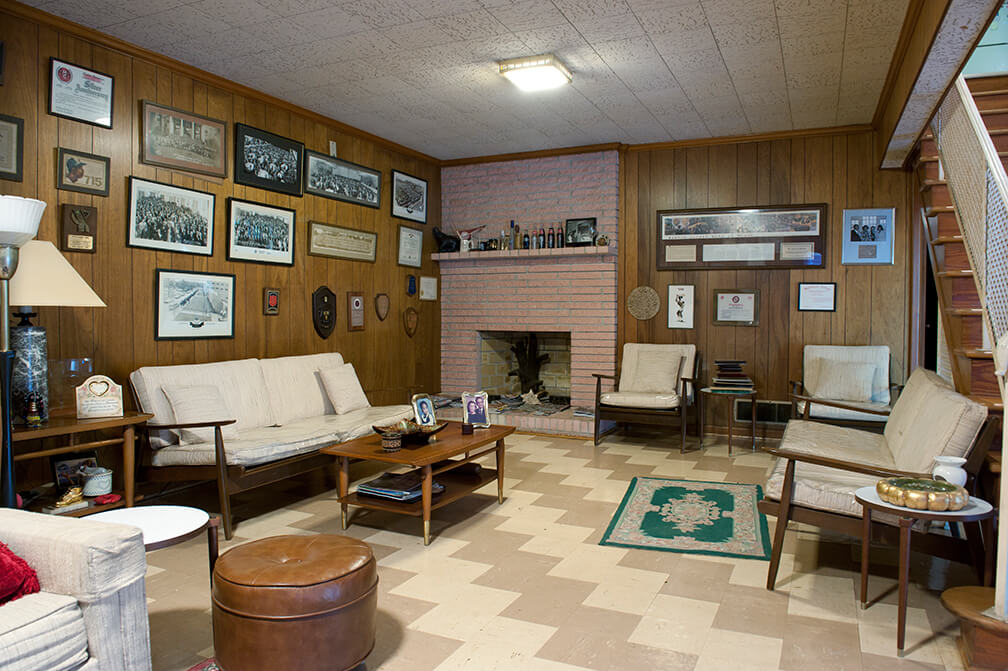
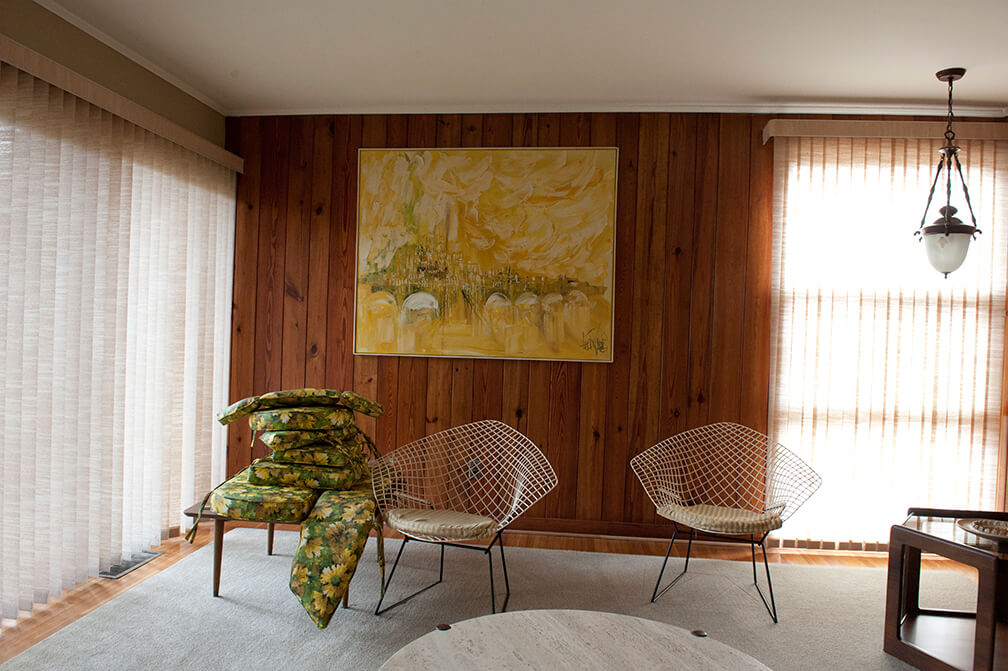
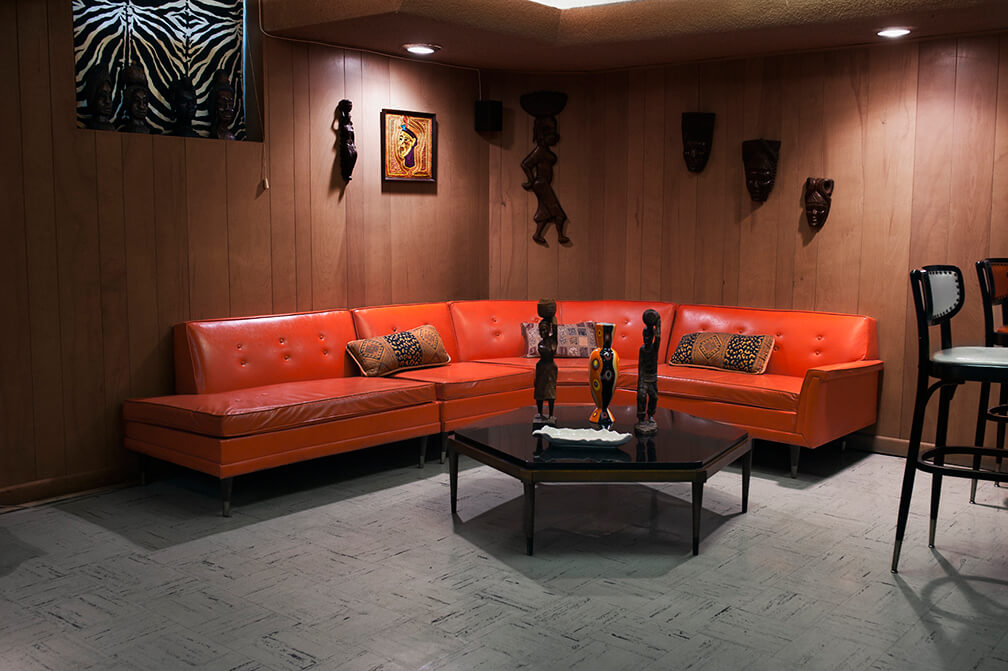
Recreation Rooms
Of the thirty-nine homes that existed in Royal Oaks Manor (a Collier Heights subdivision) in 1969, twenty-two included recreation rooms intended for "seated luncheons, dances, parties, receptions, fashion shows, games, relaxation, and television."3A considerable percentage of space was dedicated to leisure time, unlike the small houses in the original Collier Heights subdivisions that were built for middle class Americans. See Annie S. Barnes, The Black Middle Class Family: A Study of Black Subsociety, Neighborhood, and Home in Interaction (Lima, Ohio: Wyndham Hall Press, 1985), 74. Henry Herbert Bankston, a government worker and resident of Collier Heights, remembers, "I think about our getting together like we once did and it was basically because we did entertain in our basement. Or in our recreation area, that's what we called it. And that's where we had our parties, that’s where we had dances, and all, and meetings, in our basements. See, we can come in here and entertain in this living room, but that recreation room downstairs is where we came and had our little dances, where we had our club meetings, and so forth and so on. Most of these homes around here are equipped that way."4Henry Herbert Bankston, interview by author, April 12, 2012.


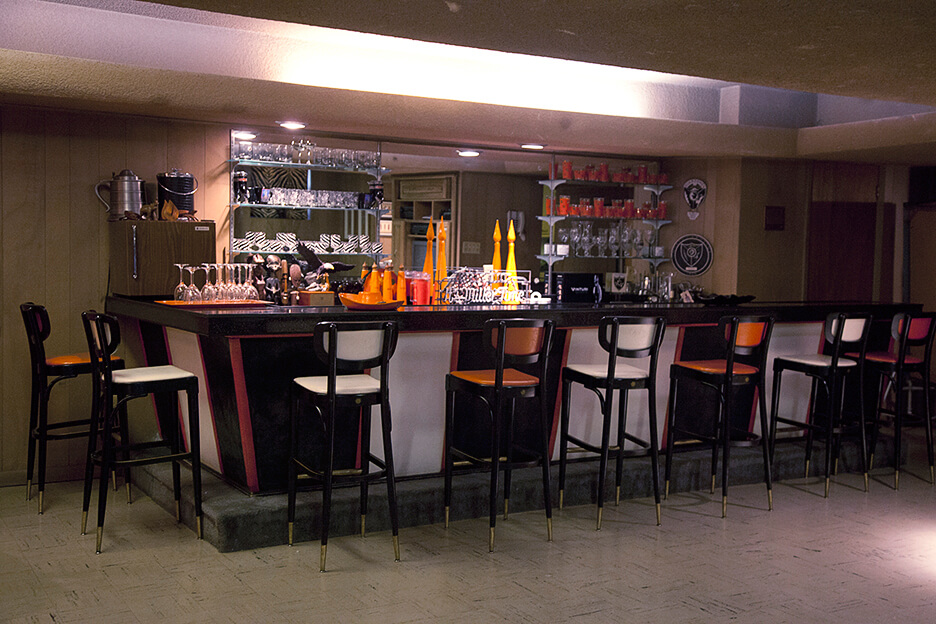
A Seat at the Counter


Faces

Alfred and Dorothy Knox, October 14, 2012.

Charles and Dr. Lois Moreland, October 12, 2013.

Dr. William B. Shropshire III and Dr. Marian Shropshire, November 14, 2011.

Dr. Harvey B. Smith, January 9, 2013.

Alma and Albert Hayward, May 17, 2015.

Constance Pruitt and her son John, April 6, 2012.

E. Gayle Barnett, January 10, 2013.
Brick by Brick
As Lorainne Hansberry writes in 1959’s A Raisin in the Sun, "we have decided to move into our house because my father—my father—he earned it for us brick by brick."5Lorraine Hansberry, A Raisin in the Sun (New York: Vintage Books, 1994), 148. For residents whose homes were built—brick-by-brick—by fellow African Americans, from conception to financing to development and construction, Collier Heights represents more than a hallmark of change. The neighborhood became a sanctuary where black Atlantans claimed a space of their own. As I return to the image of the Herman J. Russell home that begins this essay, my eye follows a stone path to the front door. As neighborhoods like Collier Heights experience new demographic shifts and historic homes go on the market, may we remember those who opened doors and paved the way.
About the Artist
Working in photography, video, and installation, Lydia A. Harris's art tackles situations of inequality and power dynamics. Her solo shows have included exhibitions at the Photographic Resource Center in Boston, the Hammonds House Museum/Auburn Avenue Research Library Auxiliary Gallery in Atlanta, and the Firehouse Center for the Arts in Newburyport, Massachusetts. Group shows have included exhibitions at the Fort Point Art Center, the Essex Art Center, the Griffin Center for Photography, the Museum of Fine Art Boston, The Light Factory’s 4th Juried Annuale in Charlotte, North Carolina, and the University of Maine Museum of Art Photo National 2011 where she received the director’s purchase award for "Hendrie." For more information, please visit the artist's website.
]]> |
| Chip Simone. Photo courtesy of Chip Simone. |
Long-time Atlanta resident Chip Simone co-founded NEXUS, Atlanta’s first photography gallery, in 1973. Originally from Worcester, Massachusetts, Simone studied at the Rhode Island School of Design with modern American photography master Harry Callahan. Simone’s photos are currently included in permanent collections at the Museum of Modern Art, the High Museum of Art, the Houston Museum of Fine Art, the Museum of Contemporary Art of Georgia, the Corcoran Gallery of Art, and in the Sir Elton John Photography Collection. Simone has also published two collections, On Common Ground: Photographs from the Crossroads of the New South (1996) and Chroma: Photographs by Chip Simone (2011), printed in conjunction with his exhibit at Atlanta’s High Museum.
When he moved from Manhattan to Atlanta in 1972, Simone initially took photographs of his wife, family members, and his new neighborhood of Virginia Highlands. In time, however, Simone shifted his focus to rarely photographed areas of urban Atlanta.
 |
| A Woman Has Her Hair Braided in Piedmont Park, 1996. Photo courtesy of Chip Simone. |
“Atlanta was struggling to redefine itself, and I was more intrigued by the nature of it as a growing and transforming American city,” Simone says. “I was more interested in discovering what was not known about Atlanta and experiencing it than in reinforcing that conventional lore. Over time, my work has evolved into a more personal and intimate view of the city and its people.”
In this clip, Simone discusses Maynard Holbrook Jackson Jr., Atlanta’s first African American mayor, and his impact on the city’s topography, race relations, and the development of its artistic community. For more information about the role that art organizations like NEXUS have played in the development of Atlanta visit MARBL’s Modern Political and Historical Collections.
Randy Gue Interviews Chip Simone

Atlanta metro region is known by many titles: as the "capital of the New South" thanks to a robust economy and rising population;1Obie Clayton, Cynthia Hewitt, and Gregory Hall, "Atlanta and 'The Dream': Race, Ethnicity, and Recent Demographic and Socioeconomic Trends," Past Trends and Future Prospects of the American City: The Dynamics of Atlanta, ed. David L. Sjoquist (Lanham: Lexington Books, 2009), 219–248. as "the capital city of black America" thanks to its substantial black middle class and its role as a key hub for black commercial activity, political leadership, and cultural production;2Richard Lloyd, "Urbanization and the Southern United States," Annual Review of Sociology 38 (2012): 483–506. and as a place of opportunity, good jobs, and a quality of life attractive to many people whose parents or grandparents left the region and the South decades ago.
The recent history of the Atlanta Metropolitan Statistical Area (MSA)3Officially the Atlanta-Sandy Springs-Roswell, GA Metropolitan Statistical Area, the "metro Atlanta" region includes the following twenty-eight counties: Barrow, Bartow, Butts, Carroll, Cherokee, Clayton, Cobb, Coweta, Dawson, DeKalb, Douglas, Fayette, Forsyth, Fulton, Gwinnett, Haralson, Heard, Henry, Jasper, Lamar, Meriwether, Newton, Paulding, Pickens, Pike, Rockdale, Spalding, and Walton. illustrates the shift of the US population to the South and West,4See Census Regions and Divisons of the United States for the states included in each Census region, http://www2.census.gov/geo/pdfs/maps-data/maps/reference/us_regdiv.pdf. As used throughout this essay, "region" refers to the Atlanta metropolitan region or Atlanta MSA. a trend that has accelerated since 1970.5Between 1970 and 2010, for example, as the Northeast's population grew by 13 percent and the Midwest's by 18 percent, the South's nearly doubled (increasing 82 percent) and the West's more than doubled (increasing 107 percent) (Table 16. Population: 1790 to 1990, retrieved from https://www.census.gov/population/www/censusdata/files/table-16.pdf; Table P1 Total Population from both the Census 2000 Summary File 1 (SF 1) 100-Percent Data and the 2010 Census Summary File 1, retrieved from American FactFinder, http://factfinder.census.gov). It especially shows the effects of what demographers are calling the New Great Migration, the movement of African Americans to the South from northern and midwestern cities.6The "New Great Migration" title stems from the fact that the pattern represents a reversal of what is known as the Great Migration, or the mass movement of African Americans out of the South primarily to northern, midwestern, and California cities, from roughly 1910 to 1970. Participants tend to have higher education and income levels than long-time southern residents, and the influx of these individuals and households into metro Atlanta has swelled the region's black middle class, which is now bigger than metro Chicago's and exceeded only by that of New York City and Washington, DC.
Localized trends complement national data. Nationally, there is the seventy-year shift from cities to suburbs. For whites, suburbanization occurred rapidly from the 1940s through the 1970s. Since the 1970s, the share of whites in suburbia has remained fairly constant (at roughly three-quarters of all whites). Whites are now exurbanizing—moving from higher density, inner-ring suburbs to emerging suburbs further from the urban core. For African Americans, the shift from city to suburb began in earnest in the 1970s (the Fair Housing Act, which outlawed discrimination in housing, became law in 1968). In the Atlanta metro region, by 2010, fully 87 percent of the African American population lived in the suburbs. The metro region now has more suburban African American homeowners than any other MSA in the country.


Despite Atlanta's reputation as a booming city, and although it has attracted hundreds of thousands of new residents—including many highly educated and high-income migrants—the metro region ranks behind nearly all other large MSAs in terms of providing its poorer residents with access to opportunities for upward mobility. And, despite the Atlanta African American population's achieving high levels of suburban residency and homeownership, residential segregation remains stubborn.7 John R. Logan and Brian Stults, The Persistence of Segregation in the Metropolis: New Findings from the 2010 Census (Washington DC: American Communities Project, Russell Sage Foundation, 2011), http://www.s4.brown.edu/us2010/Data/Report/report2.pdf. Census brief prepared for Project US2010.
This essay explores these quandaries using data from the US Census, the American Community Survey, and the Georgia Department of Education. Among the key findings is that, first, even as the metropolitan region's African American population becomes increasingly suburban, residents remain equally (if not more) likely to live in racially segregated neighborhoods. This analysis documents how stubborn residential segregation (partially the result of ongoing white flight from those areas attracting minority residents) has serious implications for black households' ability to build wealth through homeownership. The private real estate market tends to undervalue housing in more diverse neighborhoods, and the Great Recession and housing bust, which were particularly severe in metro Atlanta, have disproportionately harmed the region's minority communities.
Second, even as Atlanta's African American population becomes increasingly suburban, its African American public school students remain isolated in majority-minority schools. By 2013, African American students attending public schools within the Atlanta MSA were more likely to attend majority-minority schools (64 percent did so) than they had been in 2000 (58 percent). This is accompanied by disparities between majority-white and majority-minority schools in terms of both school quality and student achievement, which hampers black children's (particularly low-income black children's) access to upward mobility.8Raj Chetty, Nathaniel Hendren, Patrick Kline, and Emmanuel Saez, "The Equality of Opportunity Project," http://www.equality-of-opportunity.org/; John D. Barge, PK-12 Student Enrollment by Race/Ethnicity and Gender (Georgia Department of Education, Full Time Equivalent Data Collection System, 2000 and 2013). This is evidenced by the region's "especially low" upward mobility among children in low-income families, something "especially noteworthy" given the MSA's strong growth.9 Chetty, Hendren, Kline, and Saez, "The Equality of Opportunity Project."
Atlanta, "Superlative City"?
Population and demographic shifts in metro Atlanta represent broader national trends and offer extreme cases. Atlanta sits within a Census-defined, multi-state grouping ("region")10The Census-defined "South" includes Alabama, Arkansas, Delaware, District of Columbia, Florida, Georgia, Kentucky, Louisiana, Maryland, Mississippi, North Carolina, Oklahoma, South Carolina, Tennessee, Texas, Virginia and West Virginia. that has experienced rapid population growth over the last forty years; the Census South reached 114,555,744 residents in 2010—roughly double its 1970 population.11Table 16. Population: 1790 to 1990, retrieved from www.census.gov/population/www/censusdata/files/table-16.pdf; Table P1 Total Population from both the Census 2000 Summary File 1 (SF 1), 100-Percent Data and the 2010 Census Summary File 1, retrieved from factfinder.census.gov. Georgia, the fifteenth most populous state in 1970, now ranks as the ninth most populous.12"State of Metropolitan America," Brookings Institution, http://www.brookings.edu/about/programs/metro/stateofmetroamerica; US Department of Congress, Economics and Statistics Administration, Bureau of the Census, "1990 Census of Population and Housing Unit Counts" (1993), https://www.census.gov/prod/cen1990/cph2/cph-2-1-1.pdf. The Atlanta MSA has surpassed in size other population centers in the Northeast and Midwest: by 2010, metro Atlanta's population was the nation's ninth largest, exceeding that of metro Boston, metro Detroit, and metro San Francisco—all metro areas that had been larger than Atlanta as recently as 2000.13Frank Hobbs and Nicole Stoops, Census 2000 Special Reports: Demographic Trends of the 20th Century (Washington, DC: US Census Bureau, 2002), https://www.census.gov/prod/2002pubs/censr-4.pdf.
The migration of people to Atlanta from elsewhere within the United States has played a large part in the region's growth during the last decade. Between 2000 and 2010, the metro region's net domestic in-migration figure was 412,832—or roughly equivalent to the total population of the City of Atlanta in 2010 (420,003).14 William H. Frey, Diversity Spreads Out: Metropolitan Shifts in Hispanic, Asian, and Black Populations Since 2000 (Washington, DC: Brookings Institution, 2006), http://www.brookings.edu/research/reports/2006/03/demographics-frey. This wave of domestic migrants is part of what demographers are calling the New Great Migration,15Dan Bilefsky, "For New Life, Blacks in City Head to South," New York Times, June 22, 2011, A1, http://www.nytimes.com/2011/06/22/nyregion/many-black-new-yorkers-are-moving-to-the-south.html; William H. Frey, The New Great Migration: Black Americans' Return to the South, 1965–2000 (Washington, DC: Brookings Institution, 2004), http://www.brookings.edu/research/reports/2004/05/demographics-frey; Elspeth Reeve, "South Now More Integrated, More Racially Diverse," The Wire: News from the Atlantic, March 2011, http://www.thewire.com/national/2011/03/statistical-proof-south-finally-more-integrated/36096/. or the reversal (now several decades underway) of the Great Migration of southern blacks to northern, midwestern, and western cities.16The Great Migration refers to the movement of roughly six million African Americans out of the South between the years of the First World War to the 1970s. See Isabel Wilkerson, The Warmth of Other Suns: The Epic Story of America's Great Migration (New York: Random House, 2010), 8–9. Movers sought to escape the "oppressive racial climate in the South"—the segregation, discriminatory practices, and overt racism that typified the Jim Crow era. In addition to the "promise of freedom" outside the South was the wealth of opportunity in the industrial cities of the Northeast and Midwest. The millions of manufacturing jobs available to unskilled workers in these locations stood in stark contrast to the quickly evaporating pool of agricultural jobs in the rural South, which were disappearing due to the "mechanization of southern agriculture," which entirely recast what had been a very labor-intensive system. See Frey, The New Great Migration, 2; Bilefsky, "For New Life, Blacks in City Head South"; Hope Yen, "In a Reversal, More Blacks Moving Back to South: Culture, Good Jobs, Relatives Spur Return," Washington Times, February 16, 2011, http://www.washingtontimes.com/news/2011/feb/16/in-a-reversal-more-blacks-moving-back-to-south/; Thomas J. Sugrue,The Origins of the Urban Crisis: Race and Inequality in Postwar Detroit, (Princeton, NJ: Princeton University Press, 1996), 7. Since the 1970s, the portion of African Americans living in the Northeast and Midwest has fallen—a trend that has only accelerated since 1990—and the portion of American blacks currently living in the Census-designated South (57 percent) is at its highest level since 1960.17William H. Frey, "The 2010 Census: How Is America Changing?" Urban Land (2011), http://www.frey-demographer.org/briefs/B-2010-3_ULJF11_p34_36.pdf; Hobbs and Stoops, Demographic Trends of the 20th Century; Sabrina Tavernise and Robert Gebeloff, "Many U.S. Blacks Moving to South, Reversing Trend," New York Times, March 25, 2011, A1, http://www.nytimes.com/2011/03/25/us/25south.html; Yen, "In a Reversal, More Blacks Moving Back to South." There are now ten times as many black Southerners who were born in the Northeast than there were in 1970—over one million in all.18Tavernise and Gebeloff, "Many U.S. Blacks Moving to South, Reversing Trend."
The New Great Migration was prompted in part by the conditions that those migrating out of the South encountered in these cities in the 1940s, 1950s, and 1960s. Far from tolerant and open, these cities practiced their own forms of racism and racial segregation, housing newcomers in severely overcrowded and increasingly distressed neighborhoods. As these cities lost manufacturing jobs to deindustrialization, they increasingly fell short of migrants' and residents' expectations.19Sugrue, The Origins of the Urban Crisis; Rebecca Leung, "Going Home To The South," CBS News, June 12, 2003, http://www.cbsnews.com/8301-18560_162-558375.html.
Importantly for Atlanta's story, the New Great Migration represents what African Americans now envision: "Better jobs and quality of life in the South are beckoning, as is the lure of something more intangible—a sense of home."20Yen, "In a Reversal, More Blacks Moving Back to South." Participants in the New Great Migration see "less of a struggle to survive in the South"21Bilefsky, "For New Life, Blacks in City Head to South." and more opportunities for making better lives for themselves and their children.22Ibid; Leung, "Going Home To The South"; Tavernise and Gebeloff, "Many U.S. Blacks Moving to South, Reversing Trend."

Especially for African Americans, the new pull (as opposed to push) of the South and push (as opposed to pull) of the Northeast and Midwest have transformed parts of the South—particularly places in Georgia, Florida, North Carolina, and Texas—into magnets.23Frey, The New Great Migration. In Georgia, for example, the African American population has nearly tripled since 1970 after remaining almost unchanged between 1940 and 1970; the state's black population grew by nearly 601,000 residents between 2000 and 2010.24Chris Kromm, "Black Belt Power: African Americans Come Back South, Change Political Landscape," Race, Poverty & the Environment 18, no. 2 (2011): 17, http://www.southernstudies.org/2011/09/black-power-african-americans-come-back-south-shake-up-southern-politics.html.
Approximately 80 percent of Georgia's African American population growth is highly concentrated in the Atlanta metro region. African Americans from across the United States are drawn by the region's substantial black middle class as well as its diversified and growing economy.25William H. Frey, Diversity Spreads Out: Metropolitan Shifts in Hispanic, Asian, and Black Populations Since 2000 (Washington, DC: Brookings Institution, 2006), http://www.brookings.edu/research/reports/2006/03/demographics-frey. The Atlanta metro actually gained more African American residents since 1990 than any other metropolitan area in the US, and the Atlanta MSA's black population growth accounted for roughly one-fifth of all black population growth occurring in the nation's one-hundred largest metropolitan areas since 2000.26Frey, "The 2010 Census"; Brookings Institution, "State of Metropolitan America." By 2010, African Americans accounted for 32.4 percent of all Atlanta MSA residents, up from 28.7 percent in 2000—the third largest among metropolitan areas nationwide.27Steven G. Wilson, David A. Plane, Paul J. Mackun, Thomas R. Fischetti, and Justyna Goworowska. Patterns of Metropolitan and Micropolitan Population Change: 2000 to 2010 (2010 Census Special Reports), SUS Census Bureau, C2010SR-01 (Washington, DC: US Department of Commerce, Economics and Statistics Administration, and US Census Bureau, 2012), http://www.census.gov/library/publications/2012/dec/c2010sr-01.html.
Long hailed as a "mecca of the black middle class,"28Marshall Ingwerson, "Atlanta Becomes Mecca for Black Middle Class in America," The Christian Science Monitor, May 29, 1987, http://www.csmonitor.com/1987/0529/amecca.html; David L. Sjoquist, "The Atlanta Paradox: Introduction," in The Atlanta Paradox, ed. David L. Sjoquist (New York City: Russell Sage Foundation, 2000), 1–14. Atlanta featured a "wealthy and educated black aristocracy" that grew up around the city's elite black colleges of Morehouse and Spelman. The city's ranking as one of the five best US cities for blacks in business helped support and expand its black business and professional class.29Ingwerson, "Atlanta Becomes Mecca for Black Middle Class in America." Today, the Atlanta MSA has the third-highest total of black households with incomes above $100,000 (behind only New York and DC metro regions and ahead of metro Chicago). By 2011, 83,349 high-income black households lived in metro Atlanta, a 51,085-household increase since just 2000.30American Community Survey, Table B19001B, "Household Income in the Past 12 Months," 2007–2011 American Community Survey 5-Year Estimates, https://www.census.gov/newsroom/releases/archives/news_conferences/20121203_acs5yr.html. The Atlanta region is now second only to the New York City MSA in terms of its number of black homeowners. Between 2000 and 2011, metro Atlanta's black homeowners nearly tripled (from 110,872 to 317,411), surpassing totals for Chicago, Washington, and Philadelphia.31American Community Survey, Table P151B, "Household Income in 1999," Census 2000 Summary File 3 (SF 3).
Metro Atlanta not only houses one of the nation's largest concentrations of the black middle class, but it does so principally in its suburbs. This geographic dispersal from the urban core is not unique to Atlanta: between 1990 and 2010, the percentage of African Americans living in the suburbs of the country's one-hundred largest metropolitan areas jumped from 37 percent to 51 percent. For the first time, more blacks in these metros lived in suburbs than cities.32 William H. Frey, Melting Pot Cities and Suburbs: Racial and Ethnic Change in Metro America in the 2000s (Washington, DC: Brookings Institution, 2011), http://www.brookings.edu/research/papers/2011/05/04-census-ethnicity-frey. The Atlanta MSA, however, was not only ahead of this trend (47 percent of the metro's black residents were living in suburban areas in 1980), but also represents an extreme case (by 2010, Atlanta's suburbs housed fully 87 percent of the metro's African American population).33This analysis relied on the Brookings Institution's labeling of tracts as either urban or suburban, which considers urban census tracts to be those within either the primary city listed in the official MSA name or in other cities listed in the MSA names that have populations of at least 100,000. Suburban census tracts are those whose center point falls within the MSA boundary but outside the MSA's city or cities. In the Atlanta MSA, only tracts within the city of Atlanta are considered urban; all tracts outside of the city in DeKalb and Fulton Counties, as well as all tracts in Barrow, Bartow, Butts, Carroll, Cherokee, Clayton, Cobb, Coweta, Dawson, Douglas, Fayette, Forsyth, Gwinnett, Haralson, Heard, Henry, Jasper, Lamar, Meriwether, Newton, Paulding, Pickens, Pike, Rockdale, Spalding, and Walton Counties, are considered suburban. Between 2000 and 2010, the Atlanta MSA gained more suburban black residents than any other MSA.34John Sullivan, "African Americans Moving South—and to the Suburbs," Race, Poverty & the Environment 18, no. 2 (2011): 16–19, http://reimaginerpe.org/18-2/sullivan. The region's roughly half-a-million new suburban black residents number more than two-and-a-half times that for Washington and more than four times that of Chicago.35Frey, Melting Pot Cities and Suburbs.

Eleven of the Atlanta region's twenty-eight counties36These eleven include the suburban portions of DeKalb and Fulton counties, which also include sections of the city of Atlanta. accounted for nearly all (98 percent) of the metro area's increase in African American residents between 2000 and 2010; by 2010, these counties housed 79 percent of the metro's black population. For analytical purposes, these counties fall into three groups: 1) "historically black" suburban counties, or those that have long been majority-black (Clayton and DeKalb counties, and southern Fulton County); 2) "nearing majority black" suburban counties, or those in which African Americans now comprise approximately one-fourth to one-half of all residents yet which were all only roughly one-fifth African American as recently as 2000 (Cobb, Douglas, Newton, and Rockdale counties)37 At the time of publication, Cobb was included with other counties listed as "nearing majority black" because it was statistically more like those counties than those classified as "diversifying." However, at 24% black, Cobb County was on the border and could have been included as either "nearing majority black" or "diversifying." and 3) "diversifying" suburban counties, or those that were nearly entirely white in 2000 but that now have a substantial minority of African American residents (Fayette, Gwinnett, Henry, and Paulding County, and northern Fulton County). The remaining suburban counties in the Atlanta region collectively added fewer than forty-thousand African American residents (in contrast to over 200,000 white residents).

Although home to over half of the metro's African American population in 2000, Atlanta's "historically black" suburban core accounted for less than one-fourth of the growth in metro black population between 2000 and 2010. Suburban DeKalb County's non-Hispanic black population, for example, grew by just 6 percent (or by less than 20,000). In a "dramatic reversal of the longstanding pattern," not only did black population growth into historically black suburbs slow, the City of Atlanta's non-Hispanic black population actually declined by more than 30,000 between 2000 and 2010.38Eric Freeman, "The Shifting Geography of Urban Education," Education and Urban Society 42, no. 6 (2010): 674–704.
Far more of the growth in the metro's African American population occurred outside of this core—in historically less diverse suburbs. Nationally, blacks are increasingly moving to places like these: between 2000 and 2010, 2 percent of all black population growth "occurred in counties that have traditionally been black population centers," while 20 percent "occurred in counties where only a tiny fraction of the population had been black."39Tavernise and Gebeloff, "Many U.S. Blacks Moving to South, Reversing Trend." In the Atlanta metro, roughly one-third (30 percent) of all black population gains between 2000 and 2010 occurred in four suburban counties that were all approximately 20 percent African American at the beginning of the decade (the "nearing majority black" suburban counties), and nearly half (45 precent) of all black population gains occurred in five counties that were all less than 15 percent African American in 2000 (the "diversifying" suburban counties).
Cobb, Douglas, Newton, and Rockdale counties comprise the former group, the "nearing majority black" suburban counties. Across these four counties, the number of African American residents nearly doubled between 2000 and 2010 (156,262 to 298,807). In Douglas, Newton, and Rockdale Counties, the African American population tripled during this time period, and in each of these counties non-Hispanic blacks now account for roughly two-in-five residents (up from just one-in-five ten years prior).
| Geography | Non-Hispanic Black Population | % Non-Hispanic Black | Change in Non-Hispanic Black Residents (2000-2010) | % of MSA's Black Population Growth | ||
|---|---|---|---|---|---|---|
| 2000 | 2010 | 2000 | 2010 | |||
| Clayton County | 120,816 | 169,020 | 51% | 65% | 48,204 | 10% |
| DeKalb County (Outside Atlanta) | 340,238 | 360,016 | 54% | 54% | 19,778 | 4% |
| Fulton County (South) | 104,575 | 144,933 | 74% | 80% | 40,358 | 9% |
| Historically Black Subtotal | 565,629 | 673,969 | 56% | 61% | 108,340 | 23% |
| Cobb County | 112,924 | 168,053 | 19% | 24% | 55,129 | 12% |
| Douglas County | 16,978 | 51,387 | 18% | 39% | 34,409 | 7% |
| Newton County | 13,690 | 40,371 | 22% | 40% | 26,681 | 6% |
| Rockdale County | 12,670 | 38,996 | 18% | 46% | 26,326 | 6% |
| Nearing Majority Black Subtotal | 156,262 | 298,807 | 19% | 30% | 142,545 | 30% |
| Fayette County | 10,383 | 21,117 | 11% | 20% | 10,734 | 2% |
| Fulton County (North) | 23,817 | 44,039 | 8% | 13% | 20,222 | 4% |
| Gwinnett County | 76,837 | 184,122 | 13% | 23% | 107,285 | 23% |
| Henry County | 17,435 | 74,056 | 15% | 36% | 56,621 | 12% |
| Paulding County | 5,634 | 23,810 | 7% | 17% | 18,176 | 4% |
| Diversifying Subtotal | 134,106 | 347,144 | 11% | 22% | 213,038 | 45% |
| Combined | 855,997 | 1,319,920 | 68% | 75% | 463,923 | 98% |
| Atlanta | 250,769 | 222,432 | 61% | 53% | -28,337 | -6% |
| Remainder of MSA | 99,720 | 137,627 | 4% | 4% | 37,907 | 8% |
| MSA Total | 1,206,486 | 1,679,979 | 28% | 32% | 473,493 | |
"Diversifying" counties—those with nominal black populations in 2000 but where African Americans accounted for a significantly larger share of all residents by 2010—added nearly as many African Americans (213,038) as "historically black" and "nearing majority black" suburban counties combined (250,885). The numbers of African American residents in "diversifying" Fayette, northern Fulton, and Gwinnett counties each approximately doubled over the course of the decade; the numbers in Henry and Paulding counties more than quintupled.
By 2010 nearly half (47 percent) of metro Atlanta's non-Hispanic black population lived outside of the City of Atlanta and also outside those historically black suburban counties adjacent to the city. "Nearing majority black" counties' share of all non-Hispanic black residents increased from 13 percent to 18 percent. "Diversifying" counties' share jumped from 11 percent to 21 percent—ahead of "nearing majority black" suburban counties and far beyond the current share of the City of Atlanta (13 percent by 2010).

Despite blacks' substantial inroads into suburban areas further from the central city, trends among non-Hispanic white households muted the impact of this suburbanization on region-wide segregation levels. Significant "racial differences in the . . . desirability [of] particular neighborhoods" resulted in considerable differences between the migration patterns of metro Atlanta's black and white households.40Casey J. Dawkins, "Recent Evidence on the Continuing Causes of Black-White Residential Segregation,"Journal of Urban Affairs 26, no. 3 (2004): 379–400. In the Atlanta MSA, nearly all of the counties adding non-Hispanic black households between 2000 and 2010 lost non-Hispanic whites. While the number of non-Hispanic whites increased within the City of Atlanta (which lost over 30,000 non-Hispanic blacks), nearly all of the other counties gaining more than 10,000 non-Hispanic white residents were on the edges of the metro region. Besides "diversifying" Henry and Paulding counties (which added 11,533 and 33,551 non-Hispanic whites between 2000 and 2010) all other counties experiencing substantial increases in non-Hispanic whites were among those suburban counties that gained only nominal numbers of non-Hispanic blacks.41Barrow, Bartow, Carroll, Cherokee, Coweta, Forsyth, and Walton counties collectively gained over 175,000 non-Hispanic white residents between 2000 and 2010; over the same time period, the number of non-Hispanic blacks in these counties rose by less than 35,000.
 |  |
As a result, although metro Atlanta's blacks "are less geographically concentrated, less confined to areas near the urban core, and scattered more widely around the metropolitan area," they remain highly segregated.42Douglas S. Massey and Nancy A. Denton, American Apartheid: Segregation and the Making of the Underclass (Cambridge: Harvard University Press, 1993). The persistence of the Atlanta MSA's high Index of Dissimilarity between whites and blacks illustrates ongoing segregation even amid changes in geographic concentration.43The Index of Dissimilarity, a popular summary statistic for quantifying an area's level of segregation, measures how evenly the populations of two racial or ethnic groups are distributed across a particular geographic area and describes the percentage of group members who would have to move in order for their racial or ethnic group to be evenly distributed (so that each Census tract's racial breakdown would match the MSA's overall racial breakdown). In 1990, metro Atlanta's Index of Dissimilarity for white and black residents was 66.3.44A value of 60 or more is considered high. It declined only slightly over the course of the 1990s—reaching 63.9 in 2000—and again over the next decade, remaining at 58.3 in 2010.45 Logan and Stults, The Persistence of Segregation in the Metropolis.


According to an analysis of Census tract-level data from the last three decennial censuses, over the course of the 1990s, the number of "majority black" and "segregated black" tracts in the Atlanta MSA increased slightly, as did the number of metro blacks living in them.46This study considers Census tracts with at least 20 percent non-Hispanic white residents and at least 20 percent non-Hispanic black residents to be "integrated." See Sheryll Cashin, The Failures Of Integration: How Race and Class are Undermining the American Dream (New York City: Public Affairs, 2004), 42. Census tracts in which more than 85 percent were of one race or ethnicity were classified as "segregated." See Ovetta Wiggins, Carol Morello, and Dan Keating, "Prince George's County: Growing, and Growing More Segregated, Census Shows," Washington Post, October 30, 2011, http://www.washingtonpost.com/local/prince-georges-county-growing-and-growing-more-segregated-census-shows/2011/10/14/gIQAbCc1TM_story.html. If tracts did not qualify "integrated" or "segregated," they were labeled "majority white," "majority black," or "majority Hispanic," if percentages of a particular race or ethnicity exceeded 50 percent. In 2010, 10 tracts had less than 15 percent white but no majority of either blacks or Hispanics (these were classified as "majority black/Hispanic"), and 12 tracts had more 15 percent white but no majority of any race or ethnicity (these were classified as "integrated"). By 2000, fully 50 percent of the region's African American population lived in either majority black or segregated black Census tracts (up from 48 percent in 1990). This held fairly steady between 2000 and 2010: the number of blacks living in segregated black Census tracts increased by 4,511 over the decade; by 2010, nearly half (47 percent) of the Atlanta MSA's African American population still lived in majority-minority or segregated-minority tracts.47"Majority-minority" tracts include "majority black," "majority "Hispanic," and "majority black/Hispanic" tracts; "Segregated-minority" tracts include "segregated black" and "segregated Hispanic" tracts.
The persistence of segregated housing patterns despite the ongoing suburbanization of the metropolitan region's black residents is deeply troubling. It brings serious consequences for black neighborhoods and homeowners. Whites have "much stronger" preferences for living in majority-white neighborhoods.48Dawkins, "Recent Evidence on the Continuing Causes of Black-White Residential Segregation"; Genevieve Siegel-Hawley, "City Lines, County Lines, Color Lines: The Relationship between School and Housing Segregation in Four Southern Metro Areas," Teachers College Record 115, no. 6 (2013): 1–45. http://www.tcrecord.org/Content.asp?ContentID=16988. Non-Hispanic whites are less likely to stay in their neighborhoods as the percentage of African Americans in those places rises, particularly as it reaches roughly one-third of all residents.49Massey and Denton, American Apartheid. As a result, the demand for housing among non-Hispanic whites decreases as neighborhood diversity increases, ultimately creating "racial differences in housing prices" and decreasing property values in diverse neighborhoods.50Dawkins, "Recent Evidence on the Continuing Causes of Black-White Residential Segregation."
David Rusk defines this housing value "drag"—or the difference between where property values would be if race were not a factor in housing choices, and where values are since race is a factor—as the "segregation tax" that minority households, particularly blacks, are forced to bear.51David Rusk, The "Segregation Tax": The Cost of Racial Segregation to Black Homeowners (Washington, DC: Brookings Institution, 2001), http://www.brookings.edu/research/reports/2001/10/metropolitanpolicy-rusk. Rusk finds a "segregation tax" for black homeowners and non-black homeowners living in majority-black neighborhoods in the nation's one-hundred largest MSAs. The "segregation tax" rises as metropolitan segregation levels increase.52Ibid.
Throughout the Atlanta region, the median house value is typically lower in more diverse Census tracts. For example, within the City of Atlanta, the typical median value in "majority white" or "segregated white" Census tracts was roughly three to five times the typical median in "majority black" or "segregated black" tracts; in the suburbs, the typical median value in "majority white" or "segregated white" Census tracts was double that in "majority black" or "segregated black" tracts.
| Tract Integration Level | Median Home Value (2011) | |
|---|---|---|
| City of Atlanta | All Suburban | |
| Segregated White | $648,570 | $250,038 |
| Majority White | $360,740 | $246,491 |
| Integrated | $253,113 | $176,370 |
| Majority Black | $128,311 | $126,195 |
| Segregated Black | $130,818 | $138,242 |
Another way to quantify this housing value drag in the Atlanta MSA is to replicate Rusk's "segregation tax" methodology: to calculate the difference between the median value to median owner income ratios for majority-non-Hispanic white and majority-non-Hispanic black neighborhoods. On average, homeowners in "segregated white" Census tracts in the city get $1.34 more in house value for every dollar of income than homeowners in "segregated black" tracts ($4.17 versus $2.83); homeowners in "segregated white" Census tracts in the suburbs get $0.55 more in house value for every dollar of income than homeowners in "segregated black" tracts ($2.91 versus $2.36).
| Tract Integration Level | Median Value-to-Median | |
|---|---|---|
| City of Atlanta | All Suburban | |
| Segregated White | $4.17 | $2.91 |
| Majority White | $3.30 | $2.75 |
| Integrated | $3.00 | $2.55 |
| Majority Black | $3.37 | $2.30 |
| Segregated Black | $2.83 | $2.36 |
Mapping median values and median value to median owner income ratios for all Census tracts in the metropolitan area further illustrates the disparities between the more diverse inner ring suburbs (particularly those south and west of the city) and the less diverse suburban fringe (particularly the area to the far north and east of the city).
 |  |
"Historically black" southern Fulton County and "diversifying" Cobb and Gwinnett counties are good illustrations of the "segregation tax" at work. While Census tracts throughout all three counties tend to have higher median values (and are shaded yellow and green on the map above), values tend to be lower relative to incomes (resulting in the three counties appearing almost universally orange on the map above), particularly in contrast to less diverse Cherokee, Fayette, and Forsyth counties.
Lower values in diverse neighborhoods can enable more modest-income households to become homeowners and can be used as "an economic development selling point."53Ibid. Conversely, however, deflated values make homes in diverse neighborhoods "poor long-term investments" and reduce owners' ability "to build equity through homeownership" or leverage their home to borrow for other household expenses, like retirement or college tuition.54Ibid.
Residential segregation also has a tendency to concentrate the negative effects of discriminatory lending practices and differential access, based on race, to home purchase and home improvement financing. This became abundantly clear as the Great Recession unfolded and the housing bubble burst. Both were "particularly bad … for the country … and especially so for African Americans," severely, and disproportionately, affecting minority households and neighborhoods.55Algernon Austin, Reversal of Fortune: Economic Gains of 1990s Overturned for African Americans from 2000–07 (Washington, DC: Economic Policy Institute, 2008), http://www.epi.org/publication/bp220/.
This discrepancy stemmed from the fact that, during the housing boom, African Americans nationally were far more likely than whites to rely on subprime (as opposed to prime) mortgage loans.56Ibid; Rakesh Kochhar, Ana Gonzalez-Barrera, and Daniel Dockterman, Through Boom and Bust: Minorities, Immigrants and Homeownership (Washington, DC: Pew Hispanic Center, 2009), http://www.pewhispanic.org/files/reports/109.pdf. In 2006 and 2007, during the height of the boom, black borrowers were three times as likely as white borrowers to take out higher priced57Higher-priced loans are defined as those with annual percentage rates that exceed the rate of US Treasury securities of comparable maturity by 3 percentage points. The chart reflects trends among conventional, first-lien loans borrowed for the purchase of 1- to 4-family properties for owner occupancy. subprime loans (33.5 percent for blacks versus 10.5 percent for whites in 2006, 52.8 percent for blacks versus 17.5 percent for whites in 2007).58Austin, Reversal of Fortune; Kochhar, Gonzalez-Barrera, and Dockterman, Through Boom and Bust. This "racial gap in subprime lending" held across income levels, even increasing among higher-income households.59Jacob S. Rugh and Douglas S. Massey, "Racial Segregation and the American Foreclosure Crisis." American Sociological Review 75, no. 5 (2010): 629–651.
Nationally, too, borrowers with subprime loans were far more likely than borrowers with prime loans to face foreclosure; between 2005 and 2009, the foreclosure rate on subprime loans skyrocketed from 3.3 percent to 15.6 percent.60Ibid. The result: black borrowers were nearly twice as likely as white borrowers to experience foreclosure (7.9 percent versus 4.5 percent of non-Hispanic whites).61Debbie Gruenstein Bocian, Wei Li, and Keith S. Ernst, Foreclosures by Race and Ethnicity: The Demographics of a Crisis (Durham, NC: Center for Responsible Lending, 2010), http://www.responsiblelending.org/research-publication/foreclosures-race-and-ethnicity. Foreclosures hit black households so hard that the overall homeownership rate among African Americans fell from 49.4 percent in 2004 to 47.5 percent in 2008, a drop steeper than that among white households and one that wiped out four years of black homeownership gains.62Kochhar, Gonzalez-Barrera, and Dockterman, Through Boom and Bust.
Residential segregation concentrates the risks associated with subprime loans (and other predatory practices more likely encountered in minority households, such as loan flipping and equity stripping schemes) in minority neighborhoods.63Jacob S. Rugh and Douglas S. Massey, "Racial Segregation and the American Foreclosure Crisis," American Sociological Review 75, no. 5 (2010): 629–651. A study by the Department of Housing and Urban Development in the late 1990s found that high-cost subprime lending was far more common in predominantly black neighborhoods than predominantly white ones. In metro Atlanta at that time, nearly all of the Census tracts in which subprime loans accounted for at least 25 percent of refinance mortgages were at least 30 percent black.64US Department of Housing and Urban Development, Unequal Burden: Income & Racial Disparities in Subprime Lending in America, (Washington, DC: US Department of Housing and Urban Development, 2000), http://www.huduser.org/portal/publications/fairhsg/unequal.html. These disparities also existed during the housing boom of the 2000s. According to Neighborhood Stabilization Program Data reflecting high cost loans from 2004 to 2006, Atlanta MSA Census tracts with larger minority populations had larger percentages of high-cost loans than predominantly white ones—and this held for both city tracts and suburban tracts, even after controlling for owner incomes.
As the housing boom became the housing bust, the prevalence of these subprime loans made metro Atlanta one of the "distinct epicenters" of the foreclosure crisis.65Kochhar, Gonzalez-Barrera, and Dockterman, Through Boom and Bust. Of the 3,141 counties nationwide, just 270 (or 9 percent of all counties) had foreclosure rates of 1.8 percent or higher in 2008. Twenty-three of these high-foreclosure counties were in Georgia; the vast majority of these (19 of the 23) were in the Atlanta MSA.66Ibid.

These nineteen Atlanta MSA counties included all of the metro's historically black counties and also all of the "nearing majority black" and "diversifying" suburban counties. Henry County—a "diversifying" suburban county—was among just thirty-three counties in the United States to have a foreclosure rate of more than 5 percent in 2008.67Ibid.
Below the county level, Neighborhood Stabilization Program Data shows that foreclosure rates during the height of the crisis (2007 and 2008) were far higher in diverse Census tracts than predominantly white tracts, even after controlling for owner incomes.
The "economic fallout [of the housing bust] was unevenly spread over the urban landscape," and not just minority households but minority neighborhoods "bore the brunt of the foreclosures."68Rugh and Massey, "Racial Segregation and the American Foreclosure Crisis." Property values declined, hurting local homeowners whether they had been subprime borrowers or not and exacerbating disparities in values between predominantly white and predominantly minority areas.69Austin, Reversal of Fortune. This, in turn, has had serious consequences for neighborhood conditions and quality of life, on the caliber of local amenities and public services, especially public schools.
Segregation and Schools

Beyond adversely affecting the health and stability of neighborhood housing markets, residential segregation has had a profound effect on students' experiences in public schools. Just as the Atlanta region's increasing suburbanization of minority group members has not translated into the greater integration of its neighborhoods, so too has it not translated into the greater integration of its schools.70Richard Fry, The Rapid Growth and Changing Complexion of Suburban Public Schools (Washington, DC: Pew Hispanic Center, 2009), http://www.pewhispanic.org/files/reports/105.pdf. The metro region's in-school trends mirror trends found nationally: suburban areas with increasing shares of minority students have "experienced, on average, increasing segregation levels between white and minority students" (emphasis added).71Sean F. Reardon, John T. Yun, and Tamela McNulty Eitle, "The Changing Structure of School Segregation: Measurement and Evidence of Multiracial Metropolitan-Area School Segregation, 1989–1995," Demography 37, no. 3 (2000): 351–364. As suburban school districts become more diverse, many experience "white flight," prompted by "the 'push' of interracial contact and the 'pull' of nearby whiter school districts."72Charles T. Clotfelter, Are Whites Still "Fleeing"? Racial Patterns and Enrollment Shifts in Urban Public Schools, 1987–1996, Working Paper 7290 (Cambridge: National Bureau of Economic Research, 1999), http://www.nber.org/papers/w7290; Freeman, "The Shifting Geography of Urban Education." This concentrates minority households and students in particular neighborhoods and school districts or schools.73Reardon, Yun, and Eitle, "The Changing Structure of School Segregation."
In metro Atlanta, white enrollment decreased between 2000 and 2013 in school districts in "nearing majority black" and "diversifying" suburban counties—those counties where black enrollment numbers grew substantially.
A particularly dramatic transformation occurred in six suburban districts in the Atlanta MSA, all of which went from roughly one-third minority in 2000 to two-thirds minority by 2013.
Even as the percentage of African American students attending suburban schools increased from 80 percent in 2000 to 89 percent by 2013, the portion attending majority-minority74Majority-minority here refers to any school in which at least half of all students are not non-Hispanic white. For consistency sake, "integrated" schools are identified using the same criteria as those used to identify "integrated" Census tracts earlier in this essay. schools increased more than twice as fast, from 49 percent to 61 percent. In "diversifying" suburban counties, while the portion of black students attending "integrated" schools did increase slightly (from 46 percent to 50 percent), the percentage in majority white schools plummeted (from 51 percent to just 12 percent) and the percentage in majority-minority schools skyrocketed (from 3 percent to 37 percent).
| School District | County Type | % Minority | % Black | ||
|---|---|---|---|---|---|
| 2000 | 2013 | 2000 | 2013 | ||
| Cobb County | Nearing Majority Black | 33% | 57% | 22% | 31% |
| Douglas County | Nearing Majority Black | 26% | 68% | 21% | 50% |
| Gwinnett County | Diversifying | 33% | 71% | 15% | 31% |
| Henry County | Diversifying | 22% | 62% | 17% | 47% |
| Newton County | Nearing Majority Black | 34% | 63% | 30% | 52% |
| Rockdale County | Nearing Majority Black | 29% | 79% | 22% | 61% |
In "nearing majority black" suburban counties, just 12 percent of black students attended a majority-minority school in 2000; by 2013, over half (52 percent) did so. Over the decade, the portion of students in "integrated" schools in these counties also declined substantially: from 69 percent in 2000 to just 48 percent by 2013.


At the same time, districts in historically black areas of the metro region (especially the City of Atlanta, DeKalb County, and Fulton County) remained highly segregated. In the 2006–2007 school year, DeKalb had the third-highest dissimilarity index among the nation's 449 suburban school districts with at least a thousand black students; Fulton County had the fifth-highest. That year, 70 percent of Fulton County's African American students and 74 percent of DeKalb County's African American students would have had to switch schools in order for all schools in those districts to reflect the racial make-up of each district as a whole.75Fry, The Rapid Growth and Changing Complexion of Suburban Public Schools.
Both of these trends—more African American students attending majority-minority schools and increasing segregation within districts—are worrisome. While research on achievement gaps has highlighted a range of factors that may contribute to disparities between white and black students' proficiency (factors including students' socioeconomic status, school quality, and teacher experience), segregated schools have "a negative influence on academic achievement and/or [contribute] to black/white achievement gaps."76Dennis J. Condron, Daniel Tope, Christina R. Steidl, and Kendralin J. Freeman, "Racial Segregation and the Black/White Achievement Gap, 1992 to 2009," Sociological Quarterly 54 (2013): 130–157; David Card and Jesse Rothstein, "Racial Segregation and the Black–White Test Score Gap," Journal of Public Economics 91, no. 11 (2007): 2158–2184; Christy Lleras, "Race, Racial Concentration, and the Dynamics of Educational Inequality Across Urban and Suburban Schools," American Educational Research Journal 45, no. 4 (2008): 886–912; Sean F. Reardon, Joseph P. Robinson-Cimpian, and Ericka S. Weathers, "Patterns and Trends in Racial/Ethnic and Socioeconomic Academic Achievement Gaps," Handbook of Research in Education Finance and Policy (2008): 497–516; Jacob Vigdor and Jens Ludwig, "Segregation and the Black–White Test Score Gap," Working Paper 12988 (Cambridge, MA, National Bureau of Economic Research, 2007), http://www.nber.org/papers/w12988; Siegel-Hawley, "City Lines, County Lines, Color Lines."
Segregation in neighborhoods and schools intensifies "group stratification by creating resource-rich educational environments for white students and resource-poor educational environments for black students."77Condron, Tope, Steidl, and Freeman, "Racial Segregation and the Black/White Achievement Gap." Black students are more likely to have teachers with fewer years of teaching experience and attend schools with higher student turnover rates and higher poverty rates.78Eric A. Hanushek and Steven G. Rivkin, School Quality and the Black–White Achievement Gap, Working Paper 12651 (Cambridge: National Bureau of Economic Research, 2006), http://www.nber.org/papers/w12651.pdf; Richard J. Murnane, John B. Willett, Kristen L. Bub, Kathleen McCartney, "Understanding Trends in the Black-White Achievement Gaps During the First Years of School," Brookings-Wharton Papers on Urban Affairs (2006): 97–135. Resource-poor schools, where minority students and lower income students are concentrated, are less able to help students achieve and succeed.79Raj Chetty, Nathaniel Hendren, Patrick Kline, and Emmanuel Saez, "The Equality of Opportunity Project," http://www.equality-of-opportunity.org/; Hanushek and Rivkin, School Quality and the Black–White Achievement Gap.
Resource disparities between different neighborhoods and public schools are especially apparent in Atlanta, considered "one of America's most affluent metropolitan areas yet also one of the most physically divided by income" and race.80David Leonhardt, "Geography Seen as Barrier To Climbing Class Ladder," New York Times, July 22, 2013, A1, http://www.nytimes.com/images/2013/07/22/nytfrontpage/scan.pdf. Metro Atlanta is proving to be particularly inhospitable to lower-income households' upward mobility. Among the nation's fifty-five largest commuting zones (similar to metropolitan areas), Atlanta ranked fifty-second in terms of the odds that its children born into low-income families between 1980 and 1982 would reach the top income quintile as adults; these children's odds stood at just 4 percent in Atlanta.81Raj Chetty, Nathaniel Hendren, Patrick Kline, and Emmanuel Saez, Online Data Tables, "The Equality of Opportunity Project," http://www.equality-of-opportunity.org/data/. Within the MSA, low-income children's chances of reaching higher incomes as adults were worse in more diverse counties than in predominantly white ones.82Ibid.
Conclusion
The Atlanta region provides an important and instructive study of recent national trends. The migration of black Americans back to regions of the South, the suburbanization of blacks and the exurbanizing of whites, the persistent residential segregation, and the increasing segregation in schools, have all played out with particular force in Atlanta. Metro Atlanta's segregated neighborhoods and schools, which now extend well into suburbia, are not only underserving the current generation of minority homeowners and students, but stand to undercut the life chances of future generations of minority residents as well. As it booms and continues to sprawl, metro Atlanta shows how segregation puts limits on minority homeowners' ability to build wealth, minority students' ability to excel in school, and low-income families' ability to achieve upward mobility.83Condron, Tope, Steidl, and Freeman, "Racial Segregation and the Black/White Achievement Gap."
About the Author
Karen Beck Pooley is a senior associate at czb LLC, a neighborhood planning firm, and teaches in the Department of Political Science and the South Side Initiative at Lehigh University in Bethlehem, Pennsylvania. Pooley received a PhD from the University of Pennsylvania's Department of City and Regional Planning in 2007. Her research focuses on neighborhood revitalization strategies, techniques for measuring housing market conditions, and the evolution of federal, state, and local housing policy.
]]> |
| Atlanta Studies website, 2015. Screenshot of Boyd Lewis's photo of Margaret Mitchell's apartment house. Courtesy of Emory News. The website includes Boyd Lewis's original article about living in Margaret Mitchell's apartment and the building's history, an example of the original scholarship encouraged by the collaborative publication. |
Emory University's Center for Digital Scholarship (ECDS) is hosting a new website to bring together research projects, resources, and information about the Atlanta metro region and inspire new scholarship.
Atlanta Studies (www.AtlantaStudies.org), which launched Feb. 16, is an open-access online publication that features original writings and projects about the Atlanta region, resources for the region, and events such as quarterly meetups and an annual Atlanta Studies Symposium. Atlanta Studies is a collaborative effort, with editorial and advisory board members from organizations and institutions across the region and the country, and aims to engage audiences both inside and outside the academic world.
"The Atlanta metro region is large, growing rapidly, and under-studied," says Allen Tullos, co-director of ECDS. "The Atlanta Studies project offers a unique site where shared research and discussion about the region's past, present, and future can take place among collaborating institutions and organizations."
Atlanta Studies is not just for those in the academic arena, but for members of the public as well, says editorial board member Ed Hatfield, an ECDS graduate fellow in digital humanities and PhD candidate in history at Emory.
"We want to bring academic scholarship to the public at large and to make a contribution to Atlanta's media landscape, so people who are interested in history and politics can have a new source for commentary, analysis and information," Hatfield says.
Features of the Atlanta Studies Site
 |
| Atlanta Studies website, 2015. Screenshot of the projects and resources available to members of the public as well as academics. Courtesy of Emory News. The section is expected to expand as the new website takes off. |
The website publishes original scholarship on a monthly basis; the first article is Boyd Lewis' "Living at Peggy's: Where Margaret Mitchell Wrote ‘Gone with the Wind,'" an insightful telling of the history of Mitchell's famous apartment, including a first-person account of the period when Lewis occupied it.
Blog posts such as Scott Libson's "The Lost Picture Show: Remapping the Cinema Landscape of Segregated Atlanta" – about the work of Emory professors Dana White (emeritus) and Matthew Bernstein using ECDS's forthcoming Digital Atlanta Geocoder mapping system – will appear on a regular basis, Hatfield says.
"We're always looking for new and interesting voices, and we're really excited about what we're starting out with," says Sarah Melton, ECDS digital projects coordinator and a PhD candidate studying public history at Emory University. Submissions are accepted via email at AtlStudies@gmail.com and reviewed by the editorial board.
AtlantaStudies.org also offers a gateway to several projects and resources. Current featured projects are the ECDS's Battle of Atlanta smartphone-accessible tour; the Peoplestown Project about the historic neighborhood and its community-based organizing legacy; and the Inman Park Squirrel Census, with findings and often humorous stories from its "census" of the Eastern gray squirrel in an urban neighborhood.
Resources include access to historic Atlanta topographic maps, as well as to multiple Atlanta maps related to demographics, regional planning, economic development, education, public health, housing, and transportation.
How it Began
The online publication is an outgrowth of the Atlanta Studies Network, a group formed in 2012 by former ECDS digital scholarship coordinator Stewart Varner and Brennan Collins, associate director of Writing across the Curriculum and the Center for Instructional Innovation at Georgia State University. The group's purpose: to bring together people engaged in their own research projects about Atlanta. Group members' projects often pertain to community development, socio-economic issues, transportation and infrastructure, urban design, and labor and unemployment.
"When Atlanta Studies Network began, there was a lack of a space for people to find resources and research about the Atlanta, which really surprised us because Atlanta is a huge metro area," Melton says. "We wanted to create a space where people could find high-quality, interesting, original scholarship about the region, as well as resources for people who wanted to do their own projects and research."
Group members now number about 200, and the casual quarterly meetings are attended by a mix of academics and members of the public. The first annual Atlanta Studies Symposium was held at Emory University in spring 2013 and drew about 125 people; the second was held at Georgia State, and this year's symposium will take place at Georgia Institute of Technology on May 6.
"The growth and the collaboration are a credit to the leadership Emory has shown in building a digital scholarship center and promoting digital humanities," Hatfield says. "All of our colleagues in our partner institutions are supportive and in many cases doing equally impressive work in the field."
A Joint Project with Other Universities and Organizations
AtlantaStudies.org is guided by an editorial board and an advisory board, both of which reflect the cooperative nature of Atlanta Studies itself. The two boards include people from inside and outside academia.
The editorial board includes people from Emory, Georgia State, and Kennesaw State universities; the Atlanta History Center, and Atlanta Studies co-founder Varner, who is now at the University of North Carolina at Chapel Hill. The eight editorial board members represent a variety of specializations—historians, librarians, a geographer, and people with experience in community development—which helps guide the types of stories that need to be covered, Hatfield says.
Representatives from the Auburn Avenue Research Library, Emory and Georgia State universities, and Atlanta Magazine comprise the 11-member advisory board. "These are senior scholars whose expertise and wisdom we can draw on as needed," Hatfield says. "They advise on focus and give their opinions about whether there are things we could do better or if there are stories that have been underreported in the press that we should focus on with their expertise."
Hatfield says although Emory publishes the site, it's the cooperative nature of the project that makes it work.
"There are so many colleges and universities throughout the Atlanta metro area that can contribute so much to the life of the region," Hatfield says. "Until now, there hasn't been a single space for people to come together and share research and ideas, and hopefully, collaborate on projects. The website, the symposiums and the meetups are creating that space and those forums where we might see a lot of productive exchange and take advantage of the remarkable research institutions that are located here."
]]> |
| Jesse Peel, MARBL Woodruff Room, Atlanta, Georgia, October 2012. Photograph by Bryan Meltz of Emory University Photo Video. |
Dr. Jesse Peel, psychiatrist and longtime AIDS and LGBT community activist, moved to Atlanta in 1976 where he opened a practice that served primarily gay men. In the early 1980s, many of Peel's clients and friends became sick and started dying from a mysterious new disease eventually named the Acquired Immunodeficiency Syndrome, commonly known as AIDS. Shocked and galvanized by the toll of the epidemic, Peel served on the board of directors of AID Atlanta and helped found Positive Impact, an organization dedicated to providing mental health programs for people with HIV and their friends, families, and caregivers.
In this interview, Dr. Peel discusses his life as a gay man in Nashville, Tennessee, his move to Atlanta in the mid 1970s, and the geography of the LGBT community during the early years of the AIDS epidemic. In disarmingly charismatic fashion, Dr. Peel responds to questions about his life and accomplishments, often evoking audience laughter. In response to Rand Gue's query, "Why did you move to Atlanta?" Peel retorts, "When you start running into clients going into a gay bar as you're coming out, it's probably a good idea to shift to a larger venue."
Randy Gue interviews Jesse R. Peel.
This exchange presents Peel's conversational style of answering serious questions with humor. Peel's approach invites the audience to participate in thinking about difficult topics ranging from family disapproval of homosexuality, alienation from one's childhood community, fear of disease, to the loss of friends and loved ones.
Peel also discusses Atlantans' multiple and contradictory responses to the emergent AIDS epidemic, as well as the efforts of health organizations that mobilized in its wake. Peel also talks about several political debates that shaped public discourse and the treatment of AIDS patients during the early years of the disease's history in Atlanta.
In 2012, Peel donated his personal papers to Emory's Manuscript, Archives, and Rare Book Library (MARBL) to preserve and share his own experiences and stories of Atlanta's response to the AIDS epidemic with students, researchers, and the public. For more on Peel's contributions to the Atlanta LGBT community and AIDS advocacy efforts, see the Jesse R. Peel Papers.
]]>In this interview, Susannah Darrow, executive director and co-founder of the arts magazine BURNAWAY, discusses the publication’s mission and its role in the Atlanta art scene. Darrow also explores recent collaborations between urban development projects, such as the Atlanta Beltline, and burgeoning art organizations, including Low Museum and Dashboard Co-op.
About Susannah Darrow
Susannah Darrow is the executive director and co-founder of BURNAWAY, a nonprofit organization that provides coverage and critical dialogue about the arts in and from Atlanta to champion and support vibrant creative communities across the Southeast.
In 2014, Georgia Trend Magazine selected Darrow as one of Georgia's "40 Under 40." In 2013, the Georgia Center for Nonprofits included the native Atlantan among its "30 Under 30." Affiliated with the Arts Leaders of Metro Atlanta, Darrow serves on the board of directors for the Georgia Committee of the National Museum of Women in the Arts and as advisor to Atlanta Celebrates Photography. Darrow received a BA in Art History from the University of Georgia and an MA in Art History from Georgia State University.
]]>
As the 150th anniversary of the Battle of Atlanta approaches, the Emory Center for Digital Scholarship (ECDS) at Emory University has launched a self-guided mobile tour of Battle-related sites throughout the city, complete with maps, historical information, photos and videos, and even parking suggestions for those who drive the route.
The app launched with a celebration and demonstration held Wednesday, June 18 at 7 p.m. at the Atlanta Cyclorama & Civil War Museum. Another event, planned for Thursday July 17 at Emory's Robert W. Woodruff Library, will include a small exhibit of historical photos and materials from its Manuscript, Archives and Rare Book Library (MARBL) related to the Civil War and the Battle of Atlanta, which took place July 22, 1864.
Designed to enrich people's understanding of Atlanta and its history, the smartphone-friendly tour provides GPS directions and mapping, historical information about each of its twelve stops, and multimedia content including video and historical images. It requires no download and is accessible via a web link (https://battle-of-atlanta.opentour.site/tours)
The mobile tour is part of an ECDS team project that includes Daniel Pollock, a physician at the Centers for Disease Control and Prevention and a Battle of Atlanta scholar; Allen Tullos, ECDS co-director and Emory history professor; Brian Croxall, project coordinator and ECDS digital humanities strategist; Jay Varner, chief software developer for the project; Kevin Glover, Emory web developer; Chris Sawula, history graduate student, ECDS fellow, and photo researcher; and Erica Bruchko, a U.S. history and African American studies librarian at the Woodruff library.
Digital mapping that matched each historical spot with its modern-day location was done by geospatial librarian Michael Page, another member of the project team.
 |
| The Troup Hurt House and the four-gun DeGress Battery, which were temporarily captured by Confederate infantry on the afternoon of July 22, 1864, Battle of Atlanta Cyclorama, Atlanta, Georgia, 1886. Painting by the Atlanta Panorama Company. |
The stops are set up in chronological order of the Battle's events, but the tour can be stopped or started at any point. It concludes at the Atlanta Cyclorama, where an enormous circular painting of the Battle of Atlanta is displayed.
"Atlanta played a significant role in the Civil War," Pollock says. "The Battle of Atlanta was a turning point in a very important campaign that began in early May 1864 and culminated with the fall of Atlanta on September 2. It was the biggest battle in that campaign and the most consequential, and it took place in our midst."
The mobile tour gives visitors a chance to remember the Battle's significant moments in the areas where they happened: Union General William Sherman's headquarters during the Battle, on the campus of the Jimmy Carter Presidential Library; Confederate General John B. Hood's vantage point for the Battle, within what is now Oakland Cemetery; Fort Walker, marked by an earthen mound in Grant Park that was part of the Confederate defense that encircled the city; the area where the Battle of Atlanta began, now occupied by Alonzo Crim High School; the spot where Union General James McPherson was killed, marked by an upright cannon monument at McPherson and Monument avenues; and Leggett's Hill, where the Battle's most ferocious fighting took place, now the intersection of Moreland Avenue and I-20, to name just a few.
Many important Battle of Atlanta sites have been replaced by service stations, interstates, buildings, and other signs of urban growth. Still, there are surviving topographical features of the sprawling battlefield and many reminders of key events, recorded on historical markers placed just prior to the Civil War centennial in the 1950s, Pollock says.
"This application is the 21st century version of a historical marker," Croxall adds. "Markers only fit so much text, and you don't know they're there until you come across them." Another benefit is that ECDS licensed the tour software as open-source and will make it available to others who want to create their own tours, Croxall says.
 |
| Atlanta was a thriving Southern urban area prior to the Battle. Wet plate negative by George Barnard. Courtesy of Library of Congress. |
Pollock had been studying the Battle of Atlanta for more than twenty years and giving periodic tours when his friend, Tullos, suggested that his tour could be turned into a self-guided, GPS-driven mobile app with ECDS's help. Work on the project began in August 2012.
The mobile tour is a companion piece to Daniel Pollock's article "The Battle of Atlanta: History and Remembrance," published on May 30 in Southern Spaces, an Emory-based digital, peer-reviewed journal now in its tenth year. The article, written by Pollock, provides expanded information about the Battle of Atlanta and the twelve tour stops.
"It's been exciting to work on, and it's been a very collaborative project," says Tullos, who also serves as senior editor of Southern Spaces. He adds the project was particularly rewarding for Pollock, who not only has been able to share his knowledge of the Battle of Atlanta with a wider audience, but also acquired a great collection of images from reunion events that occurred for decades after the Civil War. Those images will be accessible via the Southern Spaces article.
]]>